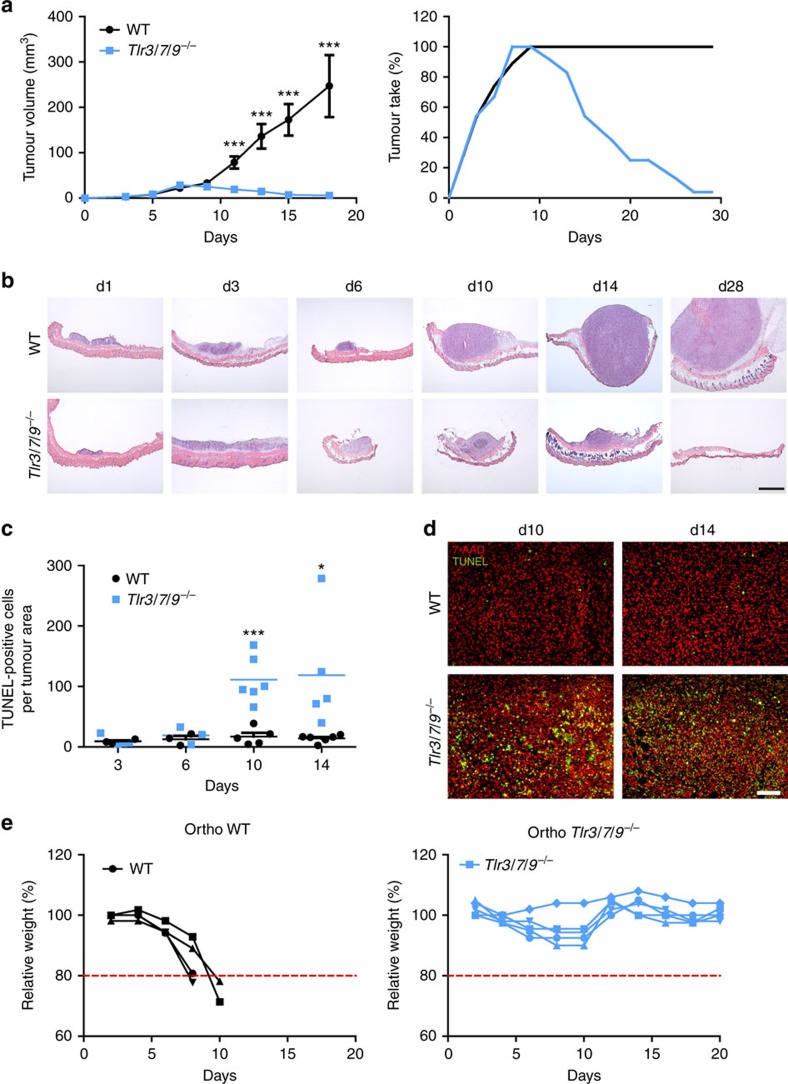
Figure 1. Tlr3/7/9−/− mice reject MOPC tumours within 3 weeks through induction of cell death.
(a) MOPC tumour cells (0.5 × 10⁶) were s.c. injected into the right flank of 8- to 16-week-old C57BL/6 WT (n=19) and Tlr3/7/9−/− mice (n=24). Mean of tumour growth±s.e.m. and tumour take (percentage of mice with a palpable tumour) are shown. Three stars (***) indicate statistical difference P⩽0.0005 (t-test). (b) Frozen sections of s.c. tumours, dissected at different time points after tumour cell injection (day 1 to day 28), were stained by haematoxylin–eosin staining. One representative example for each time point is shown. Scale bar, 1,000 μm. (c) Quantification of dead cells in MOPC tumours was determined by calculating the area of TUNEL-positive cells in relation to the entire tumour area at day 3, day 6, day 10 and day 14 after tumour cell injection (n=3–6). Single values and mean (horizontal line) are shown. Results were considered significant at *P⩽0.05 and *** P⩽0.0005 (t-test). (d) Representative examples of the TUNEL staining at day 10 and day 14 of tumours of WT and Tlr3/7/9−/− mice. Green: TUNEL, red: 7-AAD nuclear staining. Scale bar, 100 μm. (e) Tumour growth of 0.5 × 10⁶ MOPC cells after orthotopic (ortho) injection into the floor of the mouth in 8- to 12-week-old C57BL/6 WT (n=4) and in Tlr3/7/9−/− mice (n=5). Relative weight of the mice is shown. Mice were killed if they lost 20 % of their initial weight, indicated by the dotted red line.

