
Figure 2. Numbers of differentially expressed proteins in each comparison.
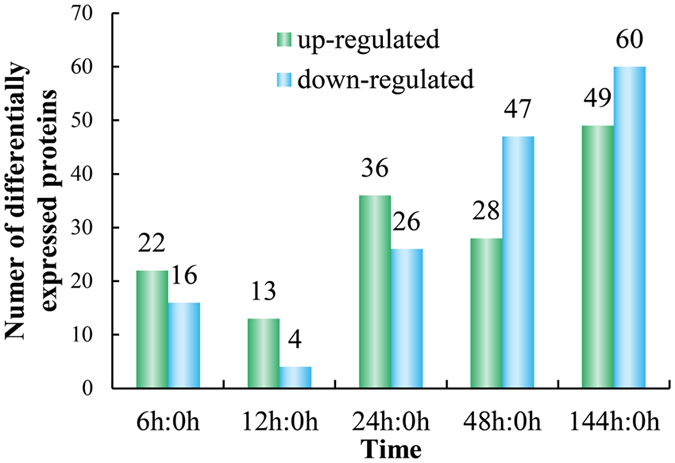
The numbers above the bars show the quantity of up-(green) and down-(blue) regulated expression proteins.
Official websites use .gov
A
.gov website belongs to an official
government organization in the United States.
Secure .gov websites use HTTPS
A lock (
) or https:// means you've safely
connected to the .gov website. Share sensitive
information only on official, secure websites.
The numbers above the bars show the quantity of up-(green) and down-(blue) regulated expression proteins.