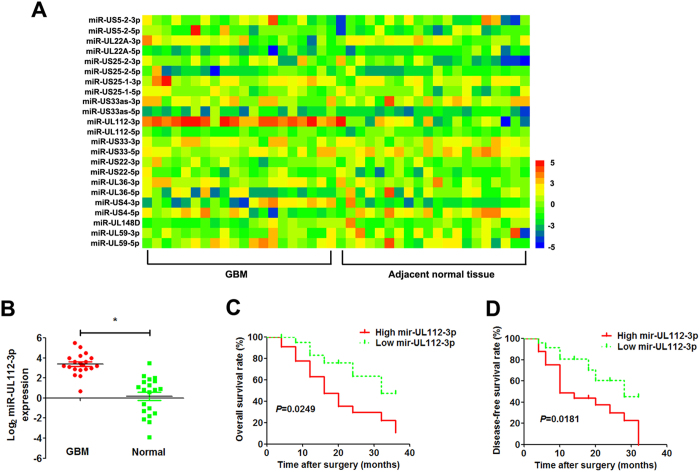
Figure 1. miR-UL112-3p is up-regulated in HCMV-positive GBM.
(A) Heatmap illustrating miRNome profiles for the 20 HCMV-positive GBM specimens. The log2 values were calculated for each sample by normalising to counting number reads alone. (B) Mature miR-UL112-3p expression was determined by qPCR in GBM and adjacent normal tissue. Data are expressed as the mean ± SD. *P < 0.05, n = 20. (C,D) Kaplan–Meier analyses of the correlations between the miR-UL113-3p expression level and overall survival rate and disease-free survival rate of GBM patients (n = 20). For each cohort, subgroups were divided according to the mean value of the cohort.

