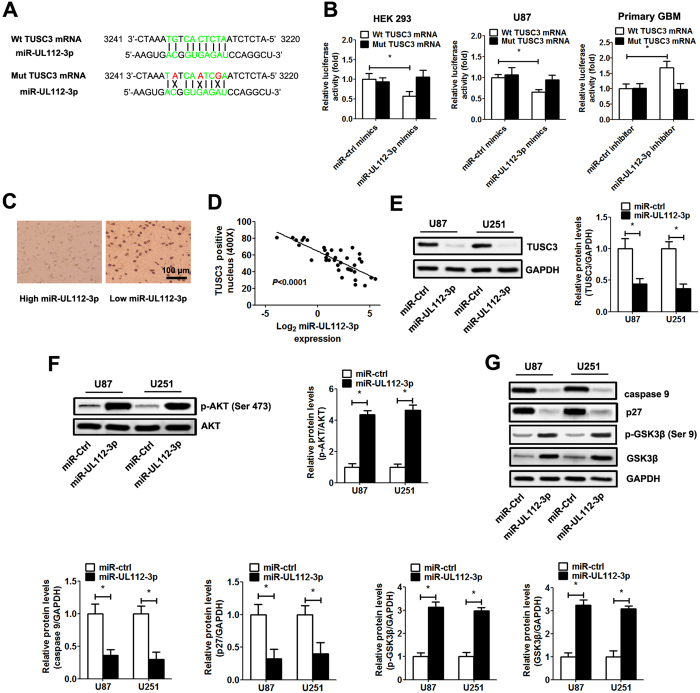
Figure 5. miR-UL112-3p negatively regulates TUSC3 expression in GBM.
(A) The predicted miR-UL112-3p target sequences in TUSC3 mRNA is shown (green bases indicate matching base pairs, and the red bases represent non-matching base pairs). (B) Luciferase assays of HEK293 and GBM cells co-transfected with wild-type/mutant pMIR-REPORT 3′UTR of TUSC3 and miR-UL112-3p mimics/inhibitor or the negative control, as indicated. (C) Immunohistochemistry analysis of TUSC3 expression in GBM specimens. (D) Spearman’s correlation analysis was used to determine the correlation between the expression levels of TUSC3 and miR-UL112-3p in human GBM samples; Spearman’s correlation, r = −0.7589 (n = 20). (E) The expression of TUSC3 was detected by Western blotting in GBM cells. (F,G) The protein levels of total and phosphorylated AKT, caspase 9, p27, p-GSK3β and GSK3β in GBM cells, as determined by Western blot analysis. Relative protein expression was calculated based on densitometric analysis of band intensities. Full-length blots are presented in Supplementary Figures S4–S6. The data are expressed as the means ± SD. *P < 0.05, n = 5.

