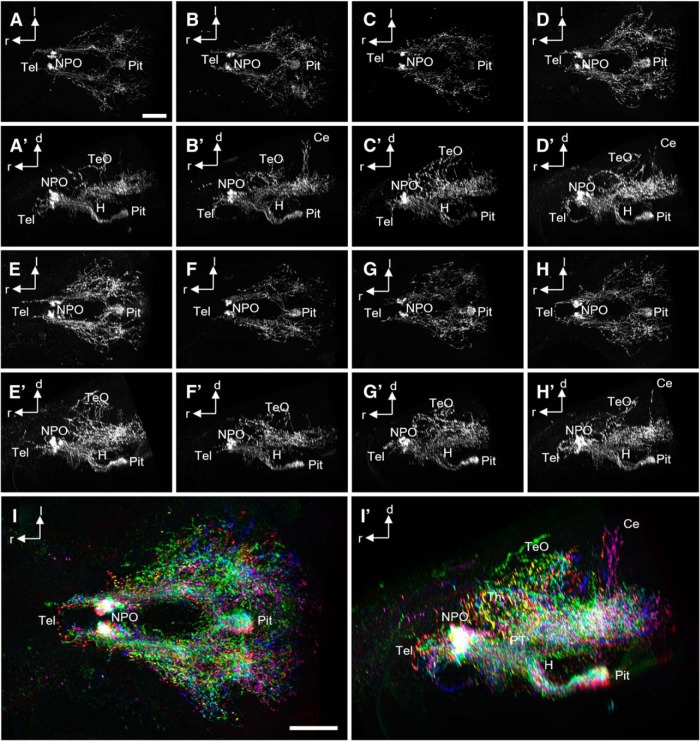
Figure 3.
Variable Oxt-positive projections at 6 dpf. A–H′, Oxytocinergic cells and their innervation patterns shown by IHC in eight different animals, dorsal (A–H) and lateral (A′–H′) views. I, I′, The same data after 3D registration of all stacks into one common model, dorsal (I) and lateral (I′) views. Each stack is shown with a different color. Note the variability of innervation patterns. Some animals show oxytocinergic innervation of the Ce, and tectal branches appear to be somewhat different in each individual. Scale bars: 100 µm.

