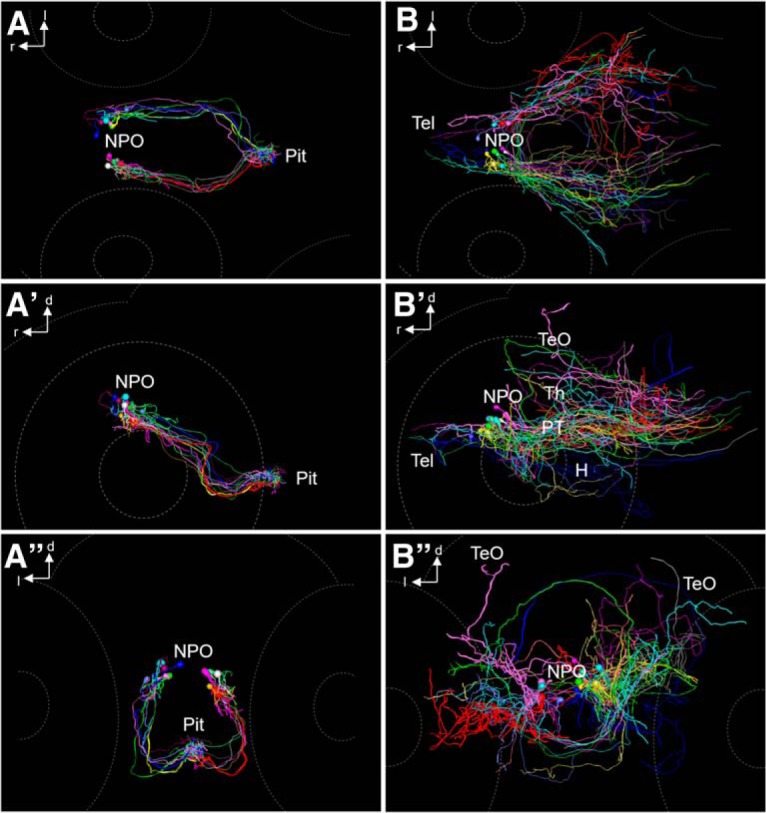
Figure 9.

Projections of Oxt-positive cells manually registered from different 6 dpf animals into one common model. A–A″, Oxt-positive cell morphology innervating the pituitary, dorsal (A), lateral (A′), and frontal (A″) views. Each cell is shown with a different color. A 3D rotation of this dataset is provided as Movie 1. B–B″, Oxt-positive cell morphology innervating regions other than the pituitary, dorsal (B), lateral (B′), and frontal (B″) views. Each cell is shown with a different color. A 3D rotation of this dataset is provided as Movie 2.
