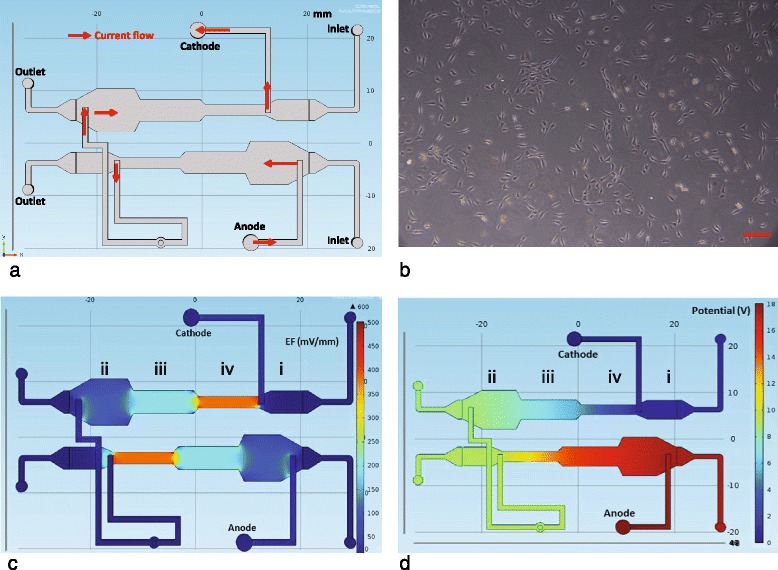
Fig. 1.

a Schematic of the microfluidic device indicating the direction of current flow, which corresponds to the direction in which cell migration is biased. b Image of 3T3 fibroblast cells, distributed at low density, during a typical experiment. The scale bar corresponds to 100 μm. c COMSOL (COMSOL, USA) simulation showing the spatial distribution of the electric field EF (mV/mm) on the microfluidic device. Markers i, ii, iii and iv are placed on the approximate location where EF=0,100,200 and 400 mV/mm, respectively. These markers indicate the approximate location where the cell migration, for each value of EF, is observed. d COMSOL (COMSOL, USA) simulation of the spatial distribution of the potential (V) on the microfluidic device
