Fig. 2.

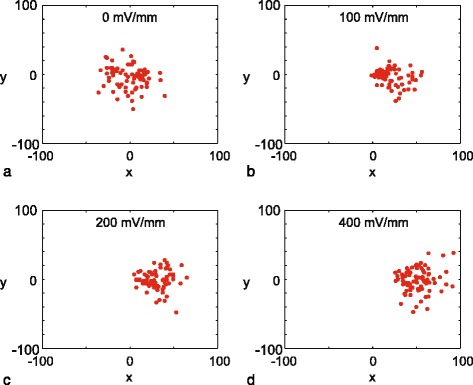
End points of cell trajectories under different experimental conditions. Results correspond to: a EF=0; b EF=100; c EF=200, and d EF=400 mV/mm. All trajectories are shifted so that the initial location of the trajectory is at the origin. In each subfigure there are 80 red dots, each corresponding to the location of the each cell after a duration of two hours
