
Fig. 4.
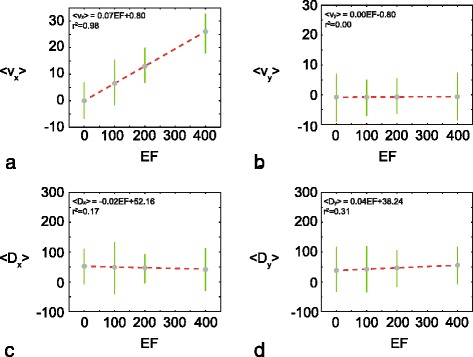
Summary of the average transport coefficients as a function of the applied gradient. a 〈v x〉 as a function of EF; b 〈v y〉 as a function of EF; c 〈D x〉 as a function of EF; and d 〈D y〉 as a function of EF. In each plot the sample mean is shown (grey circle), and the error bars indicate the variability. In this case the variability is reported as the one sample standard deviation about the mean. In each case an unconstrained linear regression is superimposed in each subfigure