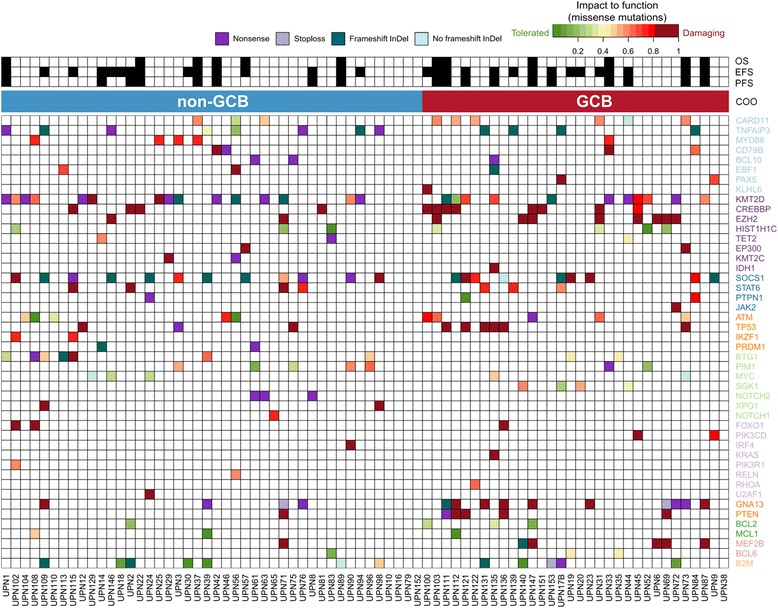
Fig. 2.

Overview of detected mutations and clinical endpoints. In the upper part of the figure, the occurrence of an event for each clinical endpoint is indicated by a filled-in square. In the lower part, mutations are color-coded by their type. Additionally, missense mutations are color-coded according to their predicted impact on protein function (MetaLR rank score, see the “Methods” section) Genes (in rows) are grouped according to their involvement in the cellular pathway and ordered according to their mutation frequencies within each group. Cases are ordered according to the cell-of-origin subtype. If multiple mutations occurred within one gene in the same case, the most damaging mutation is shown. COO cell-of-origin, EFS event-free survival, GCB germinal center B cell type, OS overall survival, PFS progression-free survival
