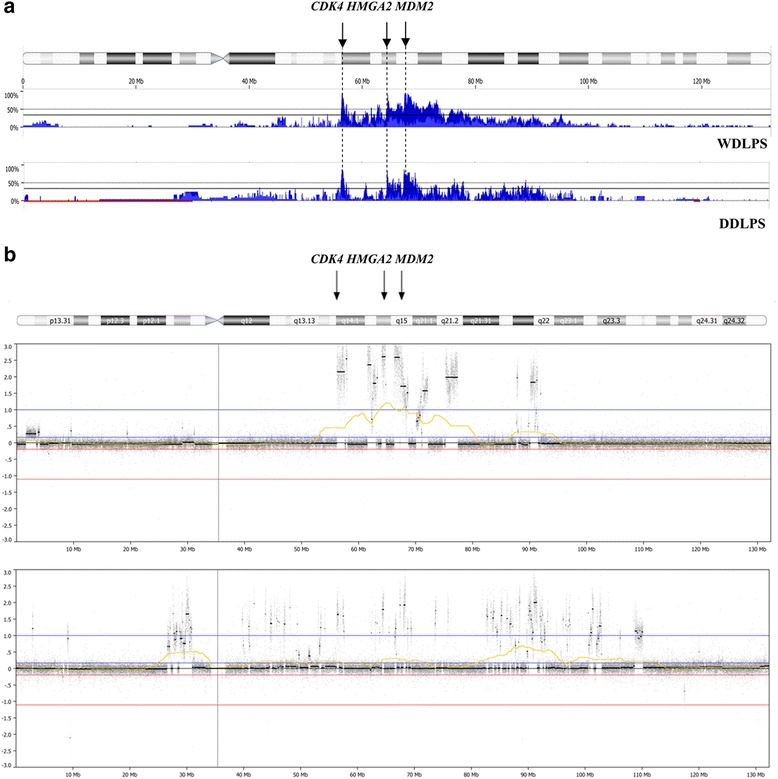
Fig. 2.

Array-CGH profile of chromosome 12 in WDLPS and DDLPS tumors. a Penetrance plots of copy number aberrations (CNAs) in 46 cases of WDLPS and DDLPS. b Examples of genomic imbalances on chromosome 12 detected by array-CGH. Blue bars indicate the percentage of tumors with an amplification in the corresponding region of the chromosome 12. Black arrows depict three peaks of amplification in this region with CDK4, HMGA2 and MDM2 loci. Increased resolution of array-CGH technique allowed for the establishing the amplification level of known oncogenes associated with WD/DDLPS pathogenesis
