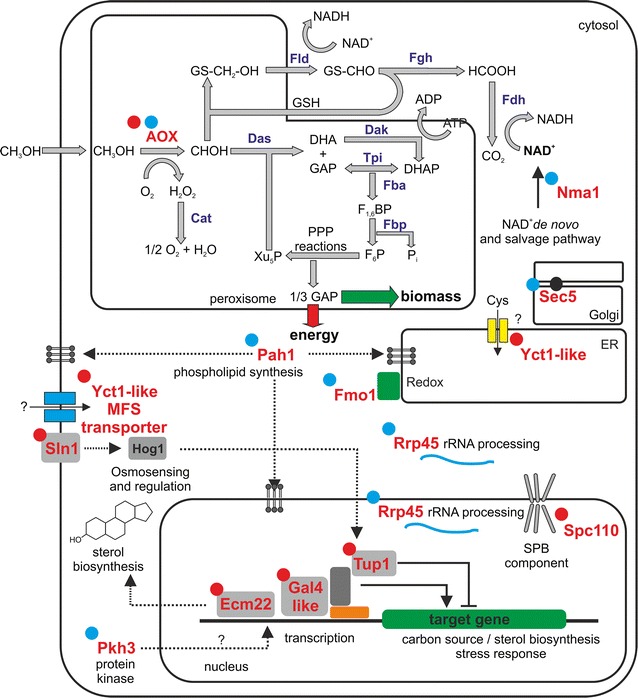
Fig. 3.

Schematic presentation of cellular pathways and genetic/protein changes. The corresponding proteins of the genes where mutations were observed (as discussed in the main text) are highlighted in red. Red dots in the upper left corner of the genes/proteins indicate mutations found in clones evolved on YP-medium and blue dots indicate mutations found in clones adapted to BM-medium. Mut-pathway: AOX alcohol oxidase, Cat catalase, Dak dihydroxyacetone kinase, Das dihydroxyacetone synthase, Fba fructose-1,6-bisphosphate aldolase, Fbp fructose-1,6-bisphosphatase, Fld formaldehyde dehydrogenase, Fgh S-formylglutathione hydrolase, Fdh formate dehydrogenase, Tpi triosephosphate isomerase
