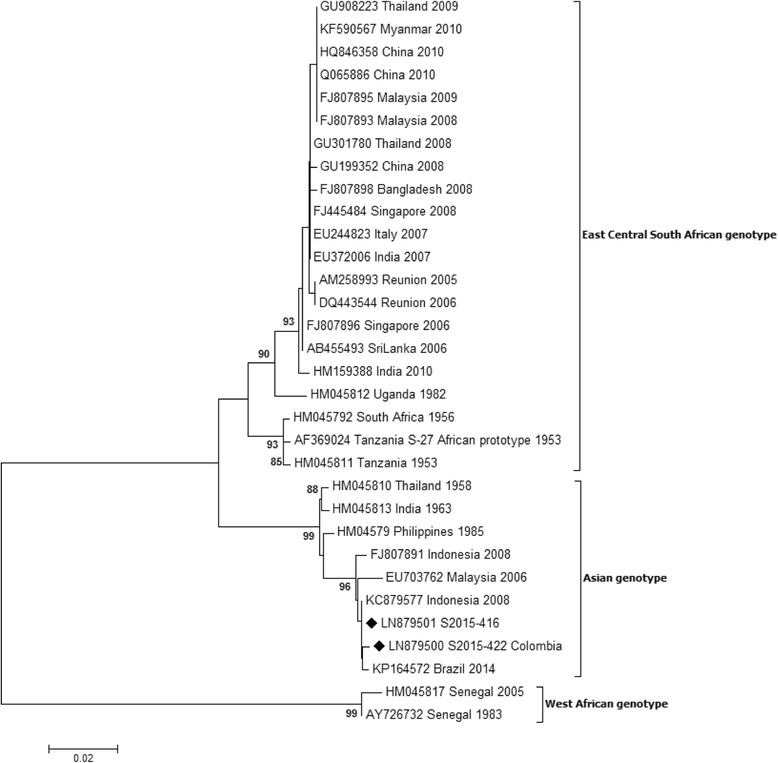
Fig. 2.

Neighbour-Joining phlylogenetic analysis of sequences obtained from CHIKV positive samples using Tamura-Nei model with 1000 bootstrap reiterations. For each sequence, GenBank accession number/viral genotype/country of origin of the infection/year of the infection are reported. Sequences characterized in this study are indicated by a black square. The bars indicate the percentage of diversity. Bootstrap values over 80% obtained from 1000 replicate trees are shown for key nodes
