
Fig. 4.
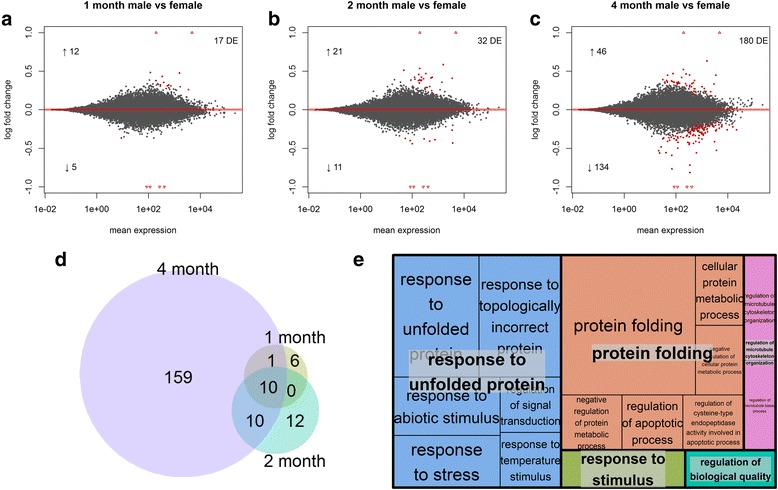
Sex biased gene expession through development. a - c: Shotgun plots for comparisons of females and males at 1, 2, and 4 months of age. In each plot the number of total differentially expressed genes is shown in the upper right corner and the number of up-regulated vs down-regulated transcripts is shown with an up or down arrow. Log2 fold changes were calculated by taking the log (base2) of the quotient of mean counts in female animals (numerator) and male animals (denominator). d: Venn diagram of sex-biased transcript expression at 1, 2, and 4 months of age. e GO enrichment treemap for transcripts with sex-biased expression at 4 months of age