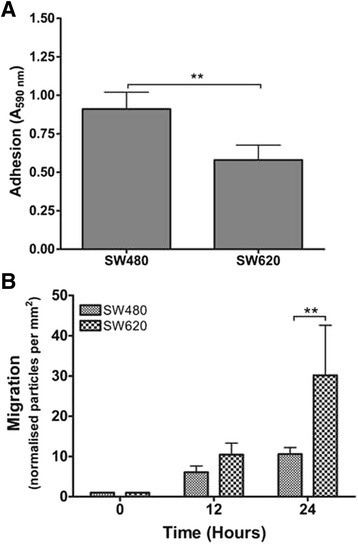
Fig. 2.

Comparison of adhesion and migration in SW480 and SW620 genetically paired colon cancer cell lines. a Adhesion of SW480 and SW620 cells was assessed by absorbance at 590 nm (y-axis) of crystal violet stained adherent cells and a comparison between the adhesion capability of the cells after 8 h was compared. b A Comparison of migration capability of SW480 and SW620 cells measuring the cells occupying the wound area after 0, 12 and 24 represented as normalised particles per area over 24 h relative to particles at 0 h (calculated using ImageJ). Graphs are representative of three independent experiments carried out in triplicate showing consistent results. Error bars indicate the standard error in the mean A students t-test was performed using GraphPad Prism 4.03 software to assess statistical significance where n = 3. (**p < 0.01, ***p < 0.001)
