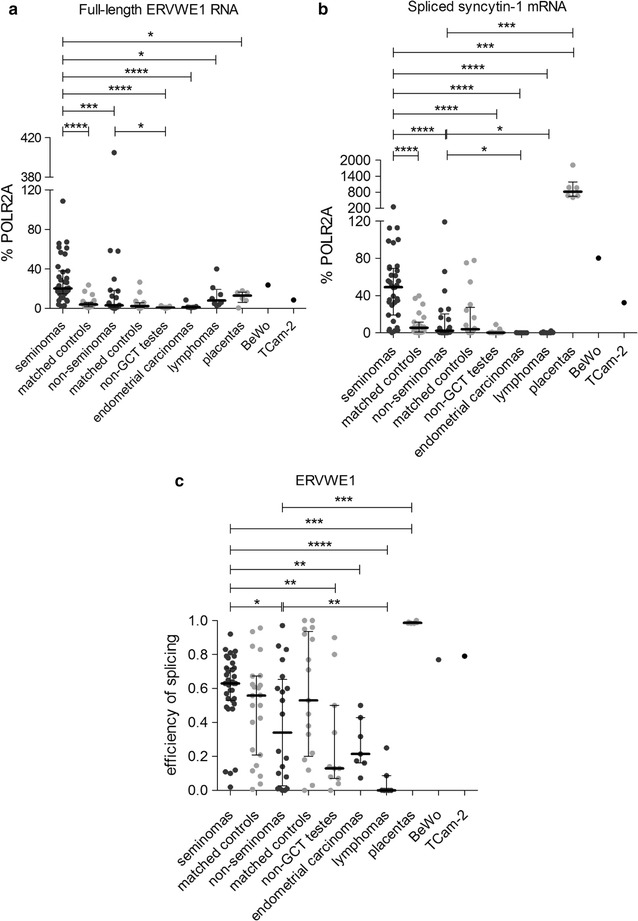
Fig. 2.

Expression analysis of the ERVWE1 locus. Expression from the ERVWE1 locus was analyzed by qRT-PCR in the panel of tumor samples. Both the full-length RNA (a) and spliced syncytin-1 mRNA (b) forms were quantified. All the data were normalized to % POLR2A. Each sample is represented by a dot and was measured as a technical triplicate. In each column, median with interquartile range is depicted. Splicing efficiency is shown in (c). Each sample is depicted by a dot which represents the ratio of spliced syncytin-1 mRNA to the sum of full-length RNA and spliced mRNA in the analyzed sample. Significance was assigned as follows: **** for P-values <0.0001, *** for P-values <0.0001, ** for P-values <0.01, * for P-values <0.05
