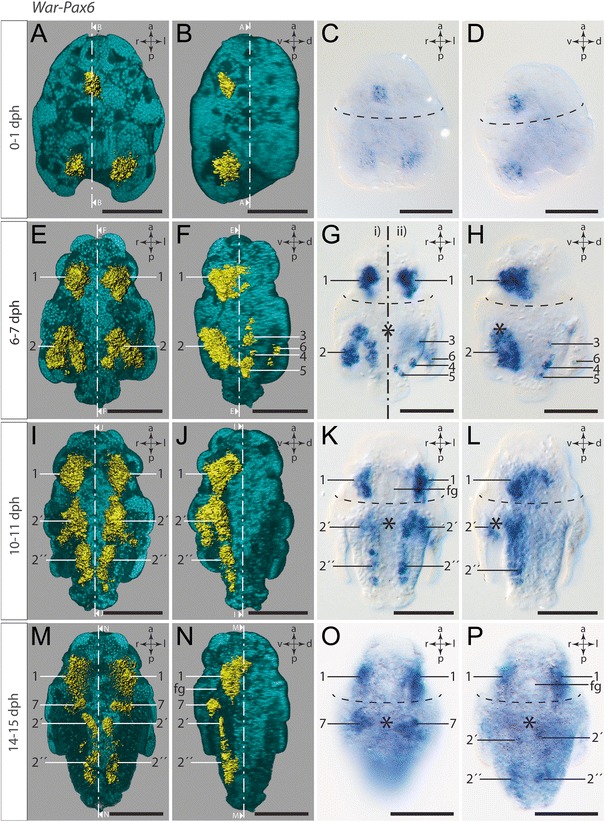
Fig. 8.

Expression of War-Pax6. Anterior faces up in all panels. Dorsal (d)–ventral (v) left (l)–right (r), and anterior (a)–posterior (p) axes indicate the orientation. First and second column are 3D-rendered images based on autofluorescence signal (turquoise) and reflection signal of War-Pax6 expression staining (yellow). The ventral half of the larvae in the first column was omitted in order to visualize the location of the ventral gene expression signal. The lateral left larval hemisphere in images of the second column was omitted in order to enable a lateral view of the gene expression signal. Clipping plane projections of the respective panels are indicated by dotted white lines. Third and fourth column are light micrographs. Location of the prototroch is indicated by dashed black lines and the mouth opening by an asterisk. Numbers mark distinguishable expression domains. a Ventral view. b Lateral left view. c Ventral view. d Lateral left view. e Ventral view. Note the first expression signal in cells of the developing cerebral ganglia (#1). f Lateral left view. g Ventral view. i) Ventral view of ventral expression domains (#2). ii) Ventral view of dorsal expression domains (#3 - #6). h Lateral left view. i Ventral view. Note the expression in the neuroectoderm of the developing ventral nerve cords (#2´ and #2´´). j Lateral left view. k Ventral view. l Lateral left view. m Ventral view. Note War-Pax6 expression in cells of the developing CNS, in particular in the cerebral ganglia (#1) and the ventral nerve cords (#2´ and #2´´), as well as the expression in cells flanking the mouth opening at the base of the invagination of the peri-imaginal space (#7). n Lateral left view. o Ventral view. p Ventral view. Note the decreasing expression in the CNS of the late larva. Abbreviation: foregut (fg). Scale bar: 50 μm
