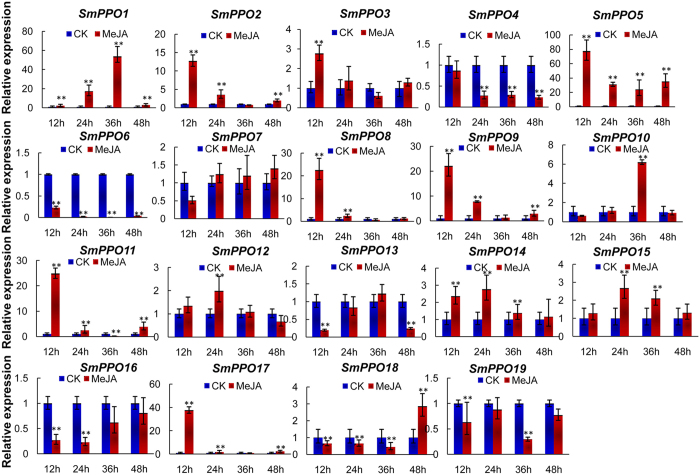
Figure 6. Quantitative RT-PCR analysis of SmPPO gene expression in S. miltiorrhiza leaves treated with MeJA.
Fold changes of SmPPOs in leaves of S. miltiorrhiza plantlets treated with MeJA for 12, 24, 36 and 48 h are shown. The level of transcripts in leaves treated with carrier solution (CK) was arbitrarily set to 1 and the levels in leaves treated with MeJA were given relative to this. Mean values and standard deviations were obtained from three biological and three technical replicates. ANOVA (analysis of variance) was calculated using SPSS. P < 0.05(*) and P < 0.01(**) were considered statistically significant and extremely significant, respectively.

