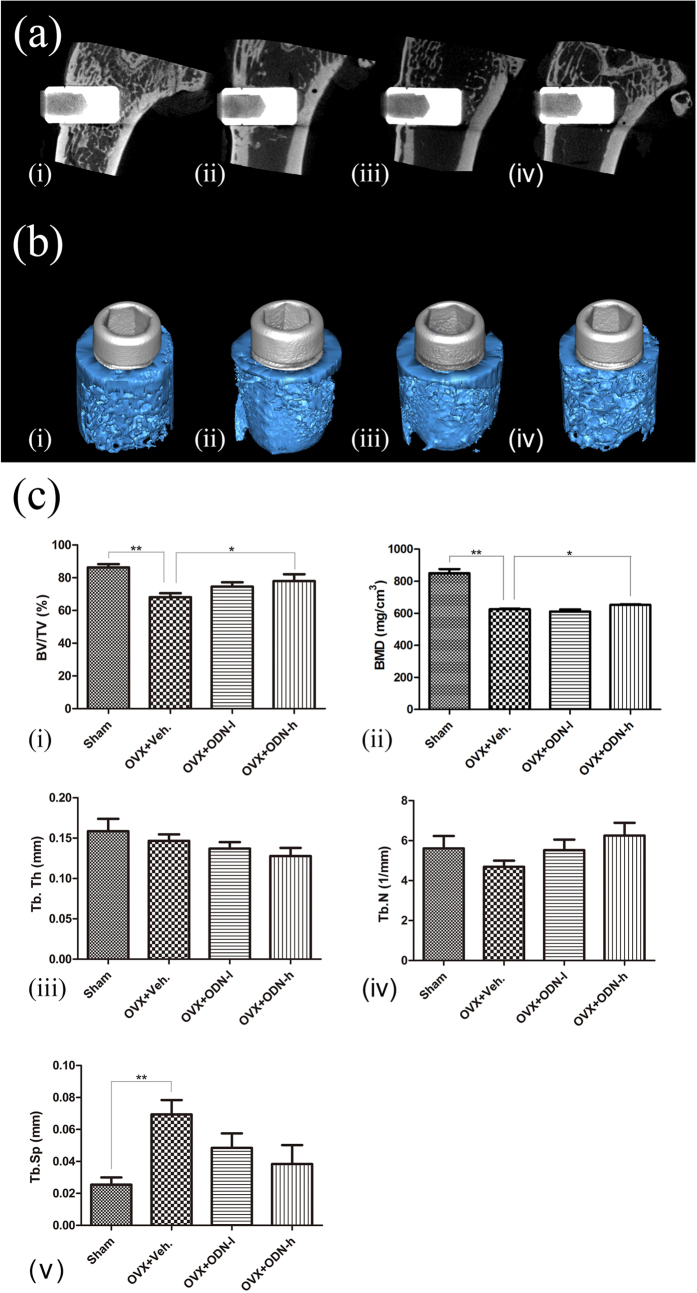
Figure 3. Improvements in bone quantity and bone mineral density shown by micro-computed tomography and the corresponding 3D models.
(a) Representative sections of micro-computed tomography images and (b) the corresponding 3D models show the differences in bone mass between the 4 groups: sham group (i), OVX + Veh group (ii), OVX + ODN-l group (iii) and OVX + ODN-h group (iv); the grey cylinders represent implants and blue portions represent bone. (c) After CatKI application, the BV/TV (i) and BMD (ii) of the OVX + ODN-h group are significantly higher than those of the OVX + Veh group. The Tb.Th (iii) and Tb.Sp (v) show a decrease with the increased dose, but the Tb.N (iv) shows an increase (*p < 0.05; **p < 0.01). ODN, odanacatib; OVX, ovariectomy; ODN-h, high-dose ODN (30 mg/kg); ODN-l, low-dose ODN (5 mg/kg); Veh, vehicle; BMD, bone mineral density; Tb.Th, trabecular thickness; Tb.N, trabecular number; Tb.Sp, trabecular separation.

