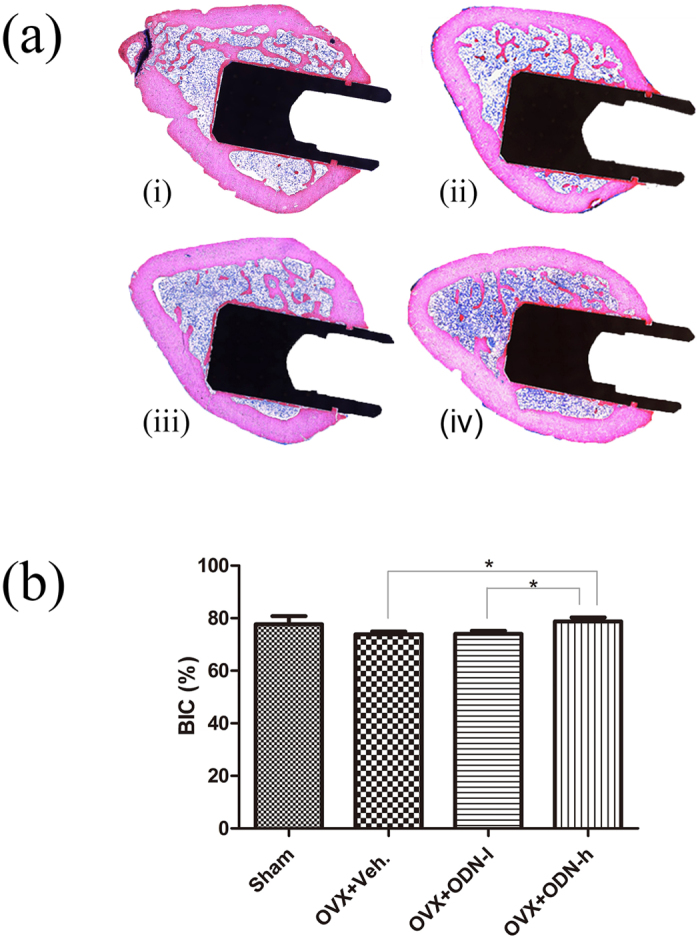
Figure 4. Light microscopy images and the BIC percentages determined by histomorphometric analysis.

(a) Light microscopy images of the (i) sham group, (ii) OVX + Veh group, (iii) OVX + ODN-l group, and (iv) OVX + ODN-h group show differences in new-bone formation and osseointegration. (b) Comparison of the BIC percentages determined by histomorphometric analysis shows significant differences between the OVX + Veh group and OVX + ODN-h group and between the OVX + ODN-l group and OVX + ODN-h group (*p < 0.05). ODN, odanacatib; OVX, ovariectomy; ODN-h, high-dose ODN (30 mg/kg); ODN-l, low-dose ODN (5 mg/kg); Veh, vehicle; BIC, bone-to-implant contact.
