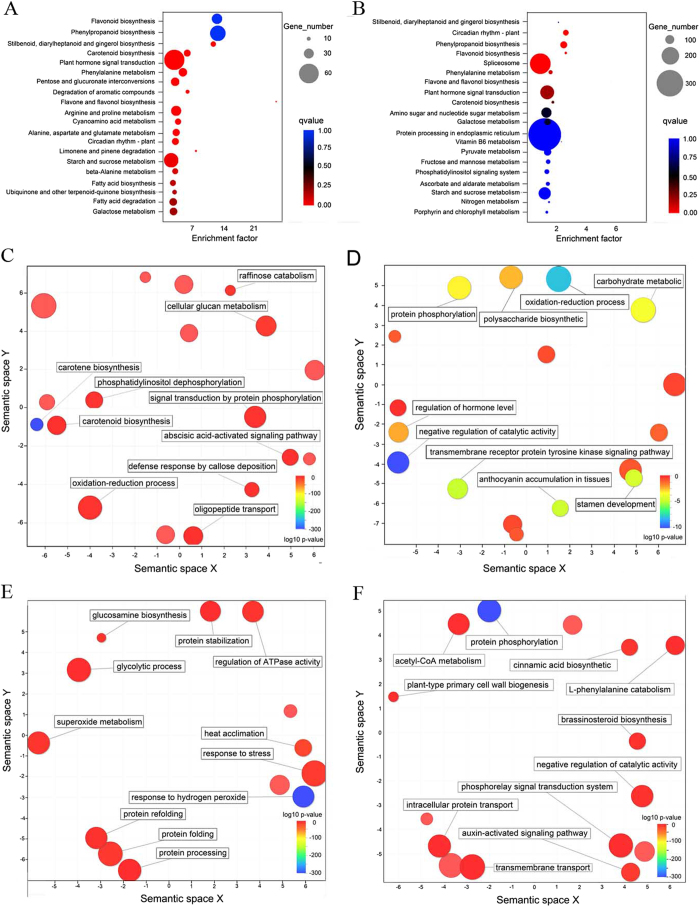
Figure 3. GO and KEGG enrichment analyses of DEGs in natural and water-treated de-astringency.
Scatterplot of enriched KEGG pathways for DEGs in natural de-astringency (10 W-vs-20 W) (A) and in water-treated de-astringency (10 W-vs-10 T) (B). The enrichment factor indicates the ratio of the differentially expressed gene number to the total gene number in a certain pathway. The size and color of the dots represent the gene number and the range of P values, respectively. GO enrichment analysis of biological processes in 10 W-vs-20 W and in10 W-vs-10 T on a subset of genes that are up-regulated (C and E) and a subset of genes that are down-regulated (D and F), respectively. To identify similar GO terms among the enriched terms, this set of GO terms was categorized using semantic clustering (REVIGO). Each ball represents a cluster of GO terms related to a similar process, and the size of the ball represents the number of GO terms grouped in that cluster. The color of the balls indicates the P value of the GO enrichment analysis; red indicates the highest P value and blue the lowest (least likely to occur by chance). The cutoff P value for the GO enrichment analysis was set to 0.01. The background used for the GO enrichment analysis was all the annotated unigenes of the assembly.

