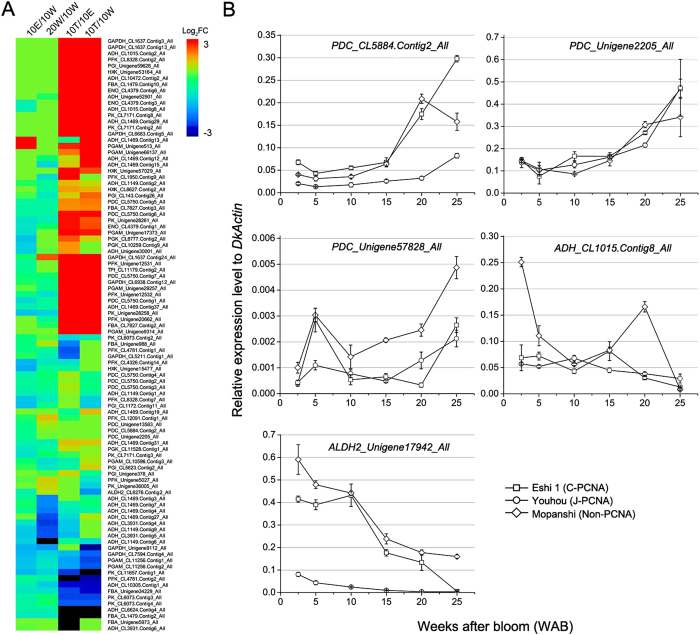
Figure 5. Acetaldehyde metabolism-related genes expression and qRT-PCR validation.
(A) The expression level of acetaldehyde metabolism-related genes in 10 W-vs-20 W, 10 W-vs-10 T, 10 W-vs-10 A, and 10 A-vs-10 T. The intensity of the Log2 fold change (−3 to 3) is indicated using rainbow scheme; red, up-regulated; blue, down-regulated. (B) qRT-PCR analysis to determine the 5 acetaldehyde metabolism-related genes from 2.5 to 25 WAB in the three cultivars. The expression level is shown as the value relative to the expression of DkActin (accession no. AB473616). The error bars indicate SD. 10 W: fruits sampled at 10 weeks after bloom (WAB); 20 W: fruits sampled at 20 WAB; 10 T: fruits sampled at 10 WAB and then treated with 40 °C water for 12 h; 10 A: fruits sampled at 10 WAB and then treated with 25 °C air for 12 h. FC: the fold change in gene expression.

