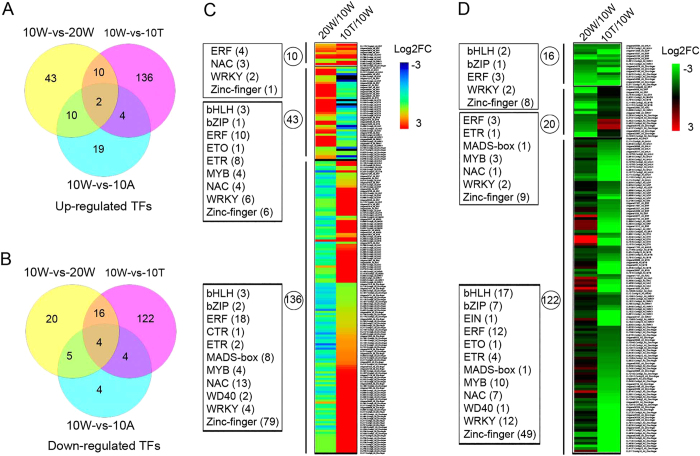
Figure 8. Overview of the differentially expressed TFs in natural and water-treated astringency removal.
Venn diagram showing the number of up-regulated (A) and down-regulated (B) TFs that in natural (10 W-vs-20 W) and after water-treated (10 W-vs-10 T) de-astringency. The expression level and classification of TFs that unique up-regulated (C) and down-regulated (D) in 10 W-vs-20 W and in 10 W-vs-10 T, respectively. The intensity of the log2 fold change (−3 to 3) is indicated using rainbow scheme; red, up-regulated; blue (left heat map) or green (right heat map), down-regulated. 10 W: fruits sampled at 10 weeks after bloom (WAB); 20 W: fruits sampled at 20 WAB; 10 T: fruits sampled at 10 WAB and then treated with 40 °C water for 12 h; 10 A: fruits sampled at 10 WAB and then treated with 25 °C air for 12 h.

