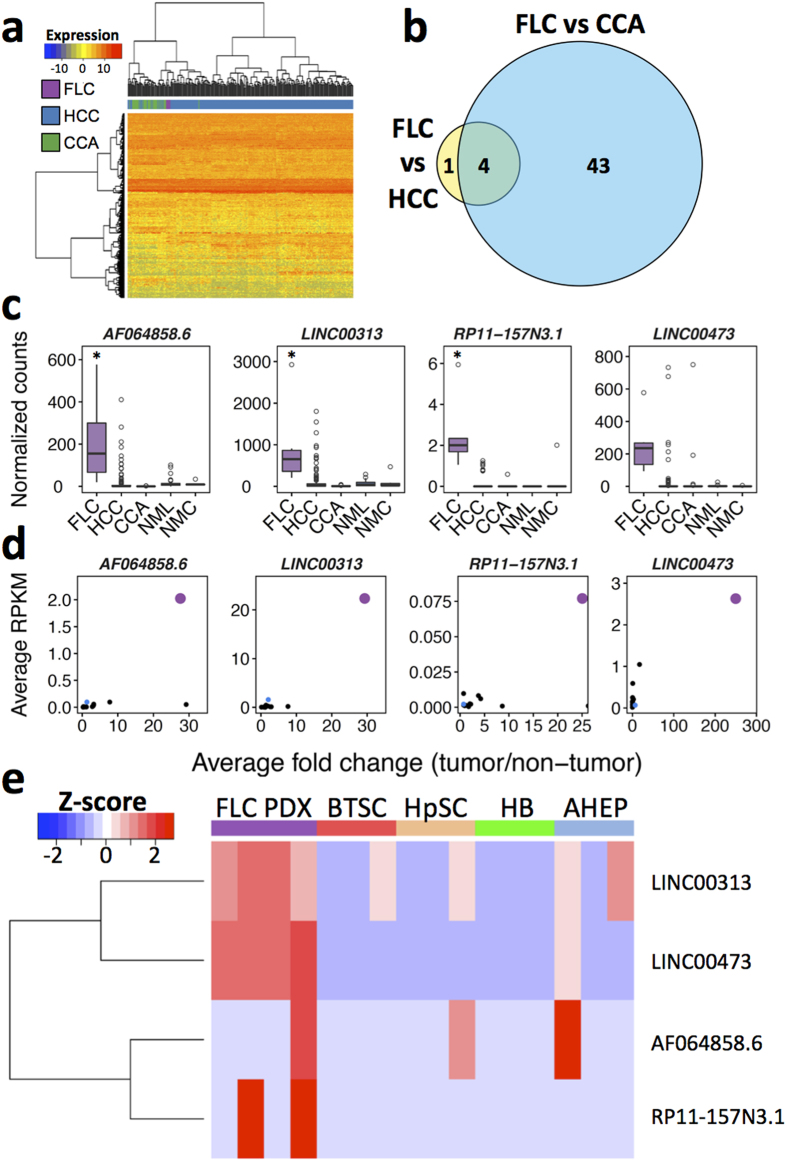
Figure 5. FLCs share a unique lincRNA expression profile.
(a) Hierarchical clustering of FLC (n = 6), HCC (n = 263), and CCA (n = 36) samples in TCGA. Clustering was performed using the 500 most variable lincRNAs across all tumors following Variance Stabilizing Transformation with Euclidian distance and Ward’s minimum variance method. (b) Venn diagram depicting differentially expressed lincRNAs between FLC and both HCC and CCA. Genes were defined as differentially expressed using the following criteria: fold change >2 and FDR < 0.05. (c) Boxplots depicting expression of the three members of the FLC lincRNA signature and LINC00473 in FLC, HCC, CCA, non-malignant liver (NML), and non-malignant cholangiocytes/bile duct (NMC) from TCGA. (d) Scatterplot of three members of the FLC lincRNA signature and LINC00473 where each point represents a different tumor type within TCGA (n = 14), with FLC marked in purple, HCC in blue, and all other tumor types in black. The x-axis displays the average fold change for each tumor type relative to the appropriate non-tumor tissue and the y-axis displays the average expression level of each lincRNA in each tumor type. (e) Heatmap showing the expression of three members of the FLC lincRNA signature and LINC00473 in a FLC patient-derived xenograft (PDX) model and four normal maturational lineage stages of the human liver: biliary tree stem cells (BTSC), hepatic stem cells (HpSC), hepatoblasts (HB), and adult hepatocytes (AHEP). *FDR < 0.05 (DESeq, negative binomial test) of FLC compared to both HCC and CCA.

