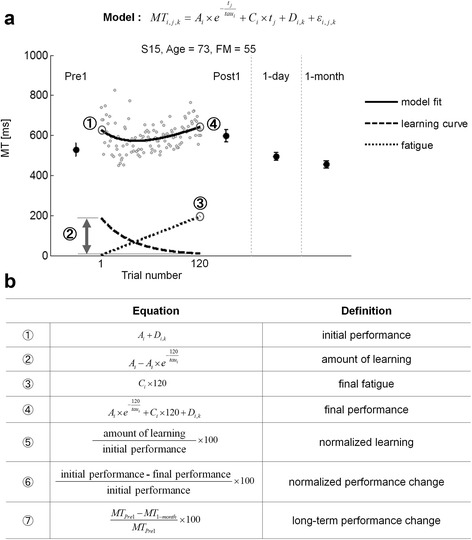
Fig. 2.

a An example of MT data and fitted model for Target 5 for subject 15 in the stroke group. Note how the model captures the initial decrease and the later increase in performance, as defined by MT. Gray dots represent individual trial-by-trial MT. Solid black lines represent the model fit; dashed lines represent the learning curve; dotted lines represent the estimated “fatigue”. MTPre1 and MT1-month represent mean MT in Pre1-test and in 1-month retention test, respectively. Pre1, Post1, 1-day, and 1-month show mean ± SE MT in Pre-test, immediate Post-test, 1-day retention, and 1-month retention test, respectively. Absolute quantities ➀ to ➃ in the table are illustrated in (b), which defines the performance and learning variables
