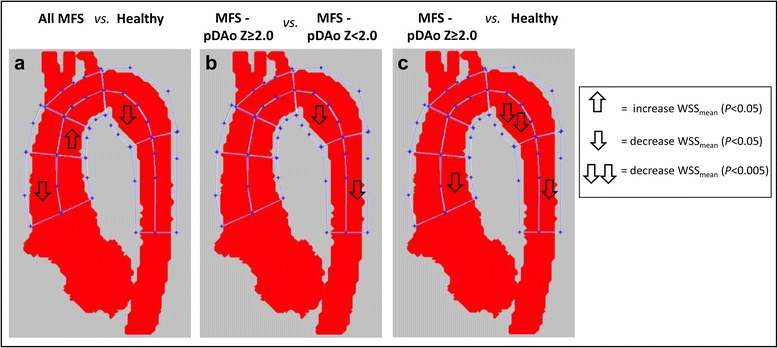
Fig. 4.

Comparison of mean systolic wall shear stress in the ten aortic regions between groups. a entire MFS cohort (n = 25) vs. healthy subjects (n = 21). b MFS with a pDAo Z-score ≥ 2.0 (n = 7) vs. MFS with a pDAo Z-score < 2.0 (n = 18). c MFS with pDAo Z-score ≥ 2.0 (n = 7) vs. healthy subjects (n = 21)
