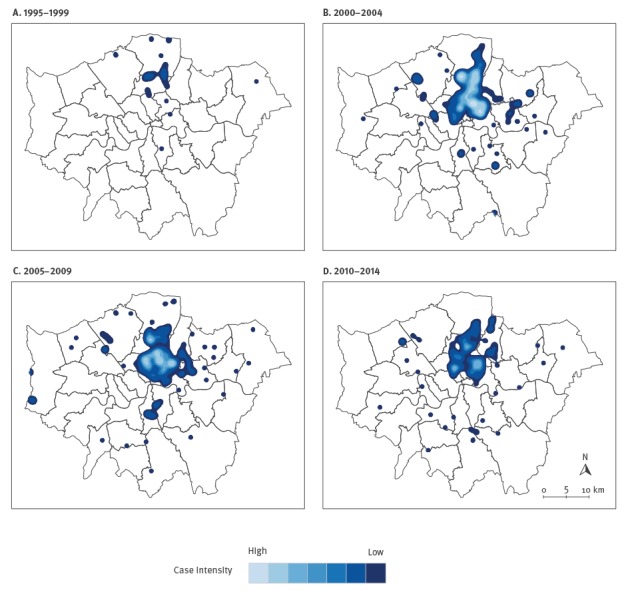
Figure 5.
Smoothed incidence maps of cases in the isoniazid-resistant tuberculosis outbreak in London, by 5-year time period, 1995–2014
Spatial intensity determined using kernel-density estimation, bandwidth 597 m. Contains Ordnance Survey data, Crown copyright and database right 2014.

