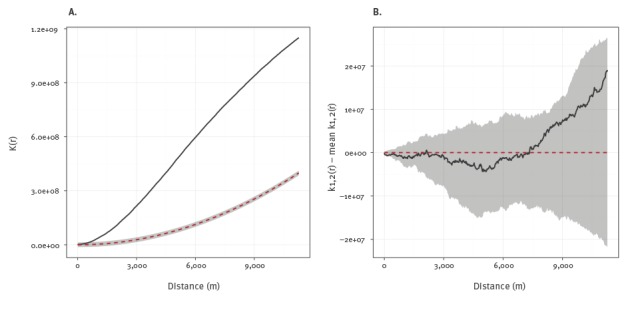
Figure 6.
K-function analysis of spatial clustering in isoniazid-resistant tuberculosis outbreak in London, 1995–2014; A: K-function test of complete spatial randomness; B: Cross k-function comparing first and second 10 years of outbreak
Simulation envelopes shaded in grey.

