Figure 2.
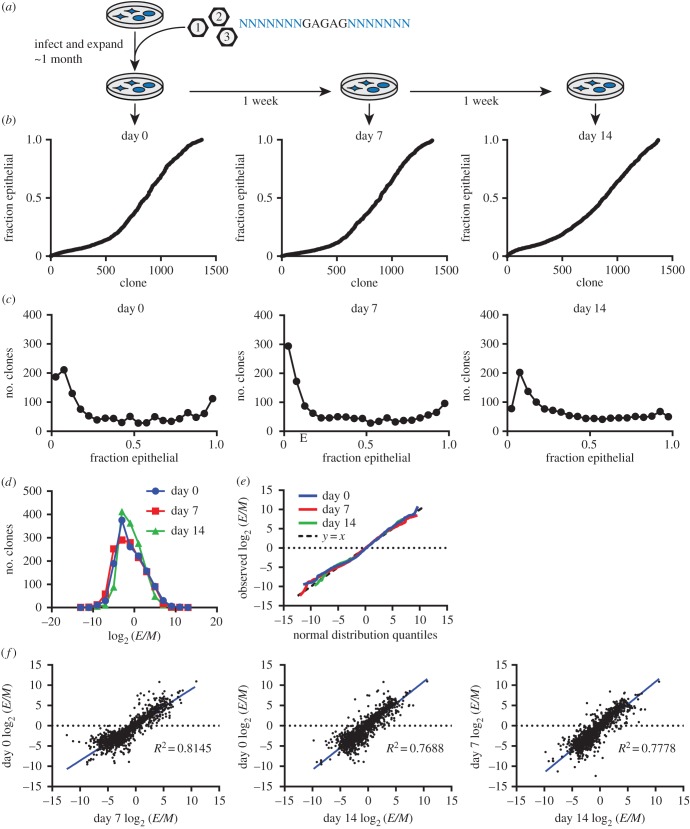
Phenotypic plasticity varies across clones. (a) Cells stably transduced with DNA barcodes were expanded over approximately 1 month into a large population. Three times over 2 weeks, samples of the population were sorted by cell state, and each clone's representation was quantified in these sorted states. (b) The fraction of each clone in the epithelial state (fraction epithelial) is plotted for each time point, showing the diversity of phenotypic plasticities among clones. Clones are sorted in ascending order by their fraction epithelial, calculated from the mean clone size in duplicate sorts. (c) Histograms of clones, binned by the fraction of each clone that is epithelial, show the distribution of clonal plasticity. Each plot is from a different time point. (d) Histogram of clones binned by their log2 ratio of epithelial (E) to mesenchymal (M) cells (log2 (E/M)), with one plot for each time point, showing phenotypic plasticity is approximately log normally distributed across clones. (e) Quantile/quantile plot with the distribution of log2 (E/M) across clones plotted against the quantiles of a normal distribution with the same mean and standard deviation, with one line for each time point. Also plotted is the line y = x (dashed line), representing a perfect normal distribution. (f) Each clone's log2 (E/M) in one time point plotted against its log2 (E/M) in another time point, showing that clones have stable phenotypic plasticity. The R2 (squared Pearson correlation coefficient) is shown, and a linear regression of the data is plotted in blue. Each clone's log2 (E/M) was calculated from the mean clone size in duplicate sorted E and M states.

