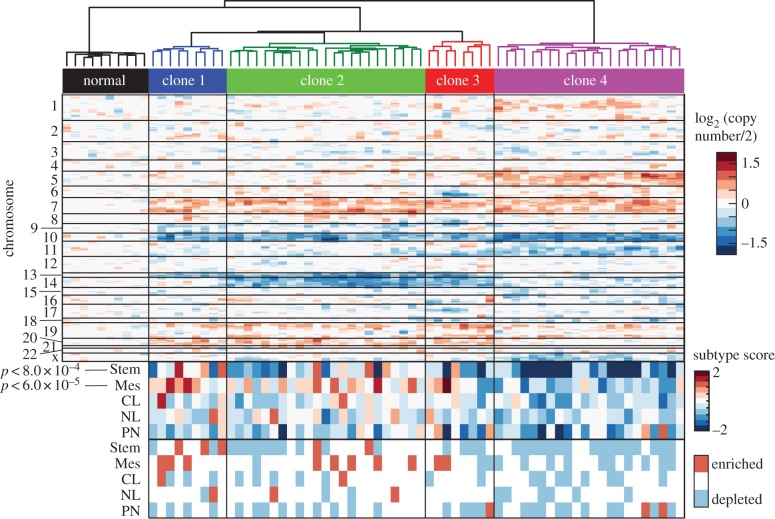
Figure 4.
Phenotypic plasticity varies across clones in vivo. At the top is a heat map of copy-number variation of single cells estimated from single-cell RNA sequencing data of a primary glioblastoma [18]. Shown is a heatmap of the averaged, normalized expression of a sliding window of 100 genes moving across chromosomes, revealing chromosomal gains and losses. Each value shows the estimated log2 (copy number/2) for genes in the window. Based on these data, clones were grouped by hierarchical clustering based on Ward clustering of the Euclidean distances between clones, shown above. Below, each cell was given a score based on the average expression of a set of classifier genes for different tumour subtypes [35] and a score for glioblastoma stemness [18], shown as a heatmap. CL, classical; NL, neural; PN, proneural; Stem, stem-like; Mes, mesenchymal. Kruskal–Wallis tests showed differential representation of the mesenchymal (Mes) subtype (p < 6 × 10⁻⁵) and the stemness score (Stem) (p < 8 × 10⁻⁴) among clones. At the bottom, each cell's subtype scores are evaluated for significance compared with the background of gene expression in that cell. Scores higher or lower than 95% of gene sets were marked as enriched or depleted.

