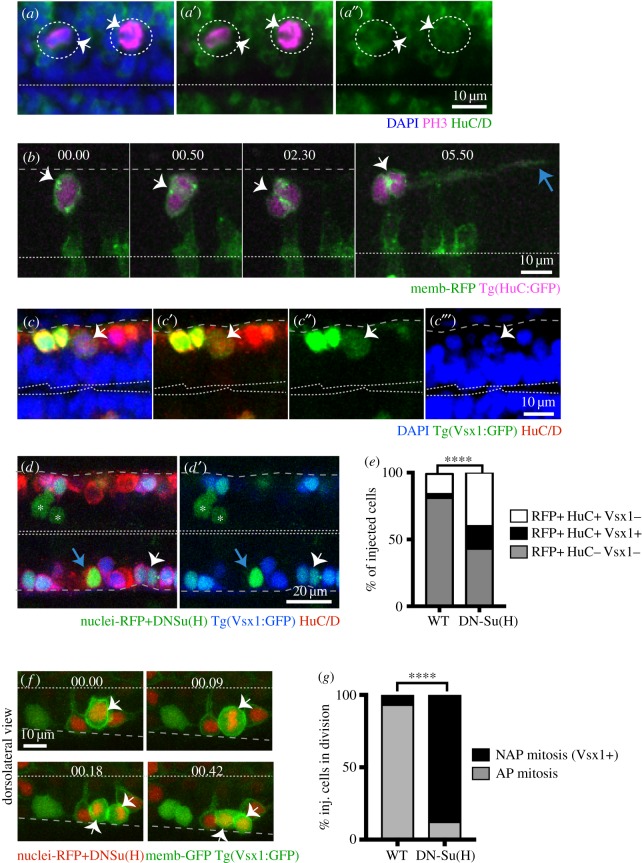
Figure 7.
NAPs and neurons share similar molecular mechanisms. (a–a″) Two NAPs (PH3+, magenta) divide away from the apical surface of the hindbrain and express the neuronal marker HuC/D (green). PH3 and HuC/D have been detected by immunohistochemistry while the overall tissue has been counterstained with nuclei marker (Sytox, in blue). Dotted circles and white arrows indicate the dividing progenitors. Dashed line at the bottom of image indicates apical surface. (b) Time-lapse sequence from projected confocal stack shows NAP in spinal cord expressing membrane-RFP (green) and Tg(HuC:GFP) (magenta) while undergoing mitosis (white arrow at time point 00.00 and 00.50) at basal surface of neuroepithelium. Later (at 5h50) the two daughter cells elongate axons (blue arrow) confirming the neuronal fate. Dashed line at the bottom of image indicates apical surface. (b,f) Time points shown in hours and minutes. (c–c′″) NAPs in the spinal cord expressing Vsx1 (Vsx1:GFP+, green) express the neuronal marker HuC/D (red) during mitosis as indicated by the white arrows. The dividing cell at top of the image is in prophase. HuC/D has been detected by immunohistochemistry and tissue counterstained with nuclei marker (Sytox, in blue). Single confocal slice from dorsal view of spinal cord. Double dashed line at the bottom of image indicates apical surface. (d–e) Mosaic overexpression of Dn-Su(H) (green labelled cells) in the spinal cord increases Vsx1 expressing (Vsx1+) NAP population (white arrows in (d) and (d′)). Cells expressing nuclear-RFP alone (control) or with Dn-Su(H) mRNAs ((d,d′) in green) can be neuronal NAPs derived (HuC/D+ and Vsx1:GFP, triple labelled in green/blue/red, indicated by white arrow), neuronal non-NAPs derived (HuC/D+ but Vsx1:GFP-, double labelled in green/red, indicated by blue arrow), non-neuronal cells (neuronal progenitors) (Vsx1:GFP- and HuC/D-, labelled in green, indicated by white asterisks). (e) The relative proportions of these distinct cell populations in control or Dn-Su(H) expressing embryos are shown in the stack bar diagram and reveal an increase in neuronal cell types (NAPs (RFP+/HuC/D+/Vsx1+) and non-NAPs (RFP+/HuC/D+/Vsx1-) derived) at the expense of non-neuronal cell types (progenitors (RFP+/HuC/D-/Vsx1-)). Data analysed using a χ2 test (****p < 0.0001). (f) Image sequence showing a dividing NAP expressing membrane-GFP, nuclei-RFP, DN-Su(H) and Vsx1:GFP in zebrafish spinal cord (white arrows). Apical surface shown by white dashed line at top of the image and basal surface shown by grey dashed line at bottom. (g) The relative proportions of mitoses occurring at the apical (AP mitosis) and non-apical (NAP mitosis/Vsx1+) locations in the spinal cord of control and DN-Su(H) expressing embryos are shown in the stack bar diagram. (f–g) Cells expressing DNSu(H) (image sequence in (f)) preferentially divide in non-apical positions and express Vsx1:GFP. (g) Data analysed using a χ2 test (****p < 0.0001).

