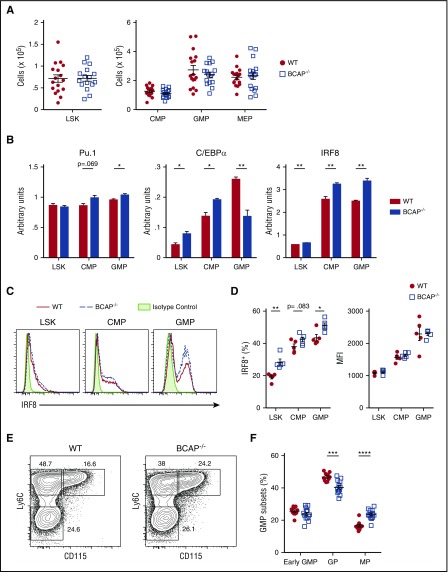
Figure 3.
BCAP−/− HSPCs are primed for monocyte differentiation in the steady state. (A) Absolute numbers of LSK (left) and CMP, GMP, and MEP (right) cells in lineage− (Lin−) BM of WT and BCAP−/− mice. Data are pooled from 4 independent experiments, with n = 16 mice per group. (B) A total of 100 000 LSK, 120 000 CMP, or 120 000 GMP cells were sorted from Lin− BM of 3 pooled WT or BCAP−/− mice. Messenger RNA (mRNA) was isolated from sorted cells and reverse transcribed into complementary DNA. Relative expression of mRNA encoding Pu.1, C/EBPα, and IRF8 was determined by qRT-PCR from WT and BCAP−/− LSK, CMP, and GMP cells. Transcription factor expression was normalized to HPRT expression and shown as arbitrary units; graphs show mean + standard deviation; data are representative of 3 independent experiments with n = 3 mice per group. (C) Representative flow plots of intranuclear staining for IRF8 or isotype control antibody in WT and BCAP−/− LSK, CMP, and GMP cells. (D) Frequencies of IRF8+ cells and mean fluorescence index (MFI) for IRF8 staining in WT and BCAP−/− IRF8+ LSK, CMP, and GMP cells. In panels C and D, data are representative of 2 independent experiments. Graphs show mean ± standard error of the mean (SEM), with n = 5 mice per group. (E) Representative flow plots of GMP subsets identified by Ly6C and CD115 expression. GMPs were gated as in supplemental Figure 2 and then early GMP (Ly6C−CD115− GMP), GP (Ly6C+CD115− GMP), and MP (Ly6C+CD115+ GMP) cells were identified as shown. (F) Frequencies of early GMP, GP, and MP cells within the GMP population; data are pooled from 3 independent experiments, with n = 10 mice per group. For all graphs, data show mean ± SEM; each symbol represents data from an individual mouse. *P < .05, **P < .01, ***P < .001, and ****P< .0001, as determined by 2-tailed, unpaired Student t test.

