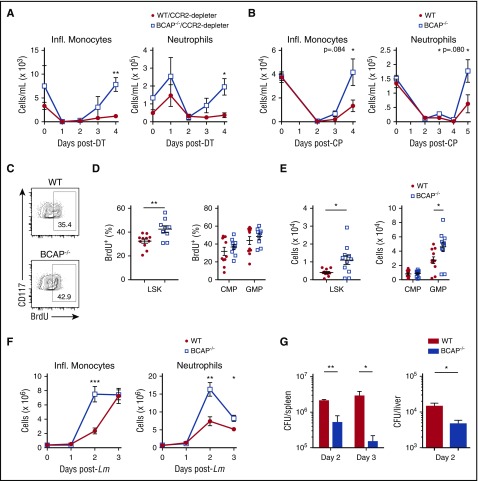
Figure 7.
BCAP−/− mice exhibit accelerated monocyte and neutrophil replenishment and/or accumulation during demand situations. (A) Absolute number of inflammatory (Infl.) monocytes and neutrophils per milliliter of blood from WT/Ccr2-depleter and BCAP−/−/Ccr2-depleter mice at the indicated times after diphtheria toxin (DT) treatment; data are representative of 3 independent experiments with n = 4 mice per group. (B) Absolute number of Infl. monocytes and neutrophils per milliliter of blood from mice at the indicated time points after cyclophosphamide (CP) treatment; data are representative of 3 independent experiments with n = 10 mice per group. (C) Representative flow plots showing LSK from WT and BCAP−/− mice treated for 48 hours with cyclophosphamide, followed by 1-hour intraperitoneal pulse administration of 1 mg BrdU. Numbers represent frequency of BrdU+ cells within indicated population. (D) Frequencies of BrdU+ LSK, CMP, and GMP cells from WT and BCAP−/− mice 48 hours after CP treatment. (E) Absolute numbers of LSK, CMP, and GMP cells in lineage− BM of WT and BCAP−/− mice 48 hours after cyclophosphamide treatment. In panels C through E, data represent 2 independent experiments with n = 11 mice per group. Data show mean ± SEM, and each symbol represents data from an individual mouse. (F) Absolute number of Infl. monocytes and neutrophils per spleen of mice at the indicated time points during L monocytogenes (Lm) infection; data are representative of 3 independent experiments with n = 3 to 5 mice per group. Data show mean ± SEM. (G) Graphs showing the number of L monocytogenes CFUs present within the spleen and liver of WT and BCAP−/− mice at the indicated days post–L monocytogenes infection. Graphs show mean ± SEM, with n = 4 mice per group. *P < .05, **P < .01, and ***P < .001, as determined by 2-tailed, unpaired Student t test.

