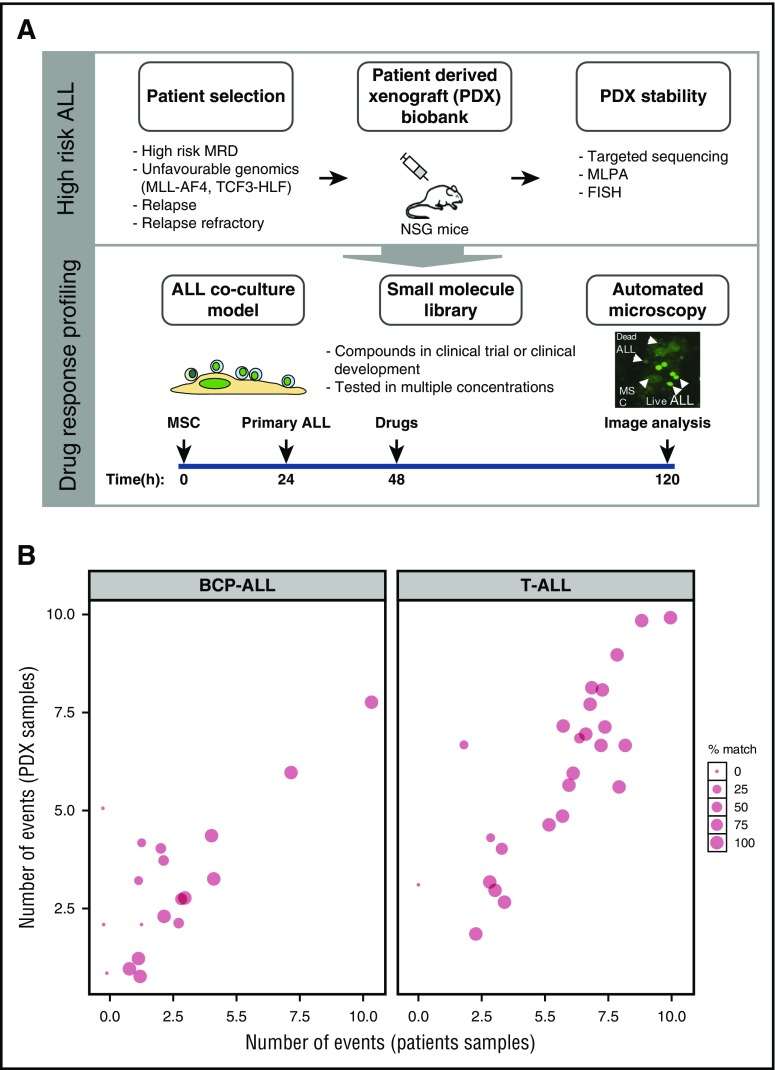
Figure 1.
Setup of the drug response profiling platform. (A, top panel) Patient material, notably from high-risk patients, including relapse patients and patients with translocations linked to poor survival, were prioritized for PDX and drug response profiling; PDX stability was evaluated against primary material by comparing targeted deep-sequenced leukemogenesis markers. (A, bottom panel) Drug profiling was performed on primary ALL cells in coculture with bone marrow–derived MSCs. Automated microscopy-based image analysis was used to quantify living ALL cells and generate dose-response curves. Imaging results were analyzed with a toolkit that performed dose-response normalization, outlier removal, rapid curve fitting, and extraction of response parameters (IC50, area under the curve, Emax, which corresponds to the percentage of viable cells at the maximum dose of the drug). Selected single compounds and combinations were validated in the xenograft model. This platform enabled the identification of drug-response phenotypes in individual ALL patients, providing an additional layer of information to facilitate individual treatment approaches. (B) Our PDX model preserves an average of 74% of the mutations and insertions/deletions initially detected in patients, making it an ideal source of material for drug-response testing in multicenter, co-clinical settings. MLPA, multiplex ligation-dependent probe amplification; FISH, fluorescent in situ hybridization.

