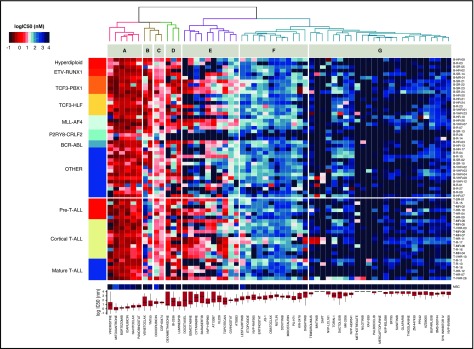
Figure 2.
Drug response profiles of BCP-ALL and T-ALL. Heatmap indicating the response of BCP-ALL (n = 44) and T-ALL (n = 24) to 60 compounds and represented by IC50 values. Samples (rows) were ordered according to clinical classification, and compounds (columns) were ordered according to activity. The IC50 distribution range for each compound is shown on the lower panel forming drug clusters. (A) Generally active drugs, mean IC50 values <10 nM. (B) Drugs more active in BCP-ALLs than T-ALLs. (C) Generally active drugs with IC50 values <100 nM. (D) Drugs with variable activity. (E) Drugs with activity linked to cycling activity. (F) Generally active drugs with high nanomolar range. (G) Generally inactive drugs, with sporadic exceptions. Heatmap of MSCs and drug IC50 distribution box plot are shown on the lower part of the graph.

