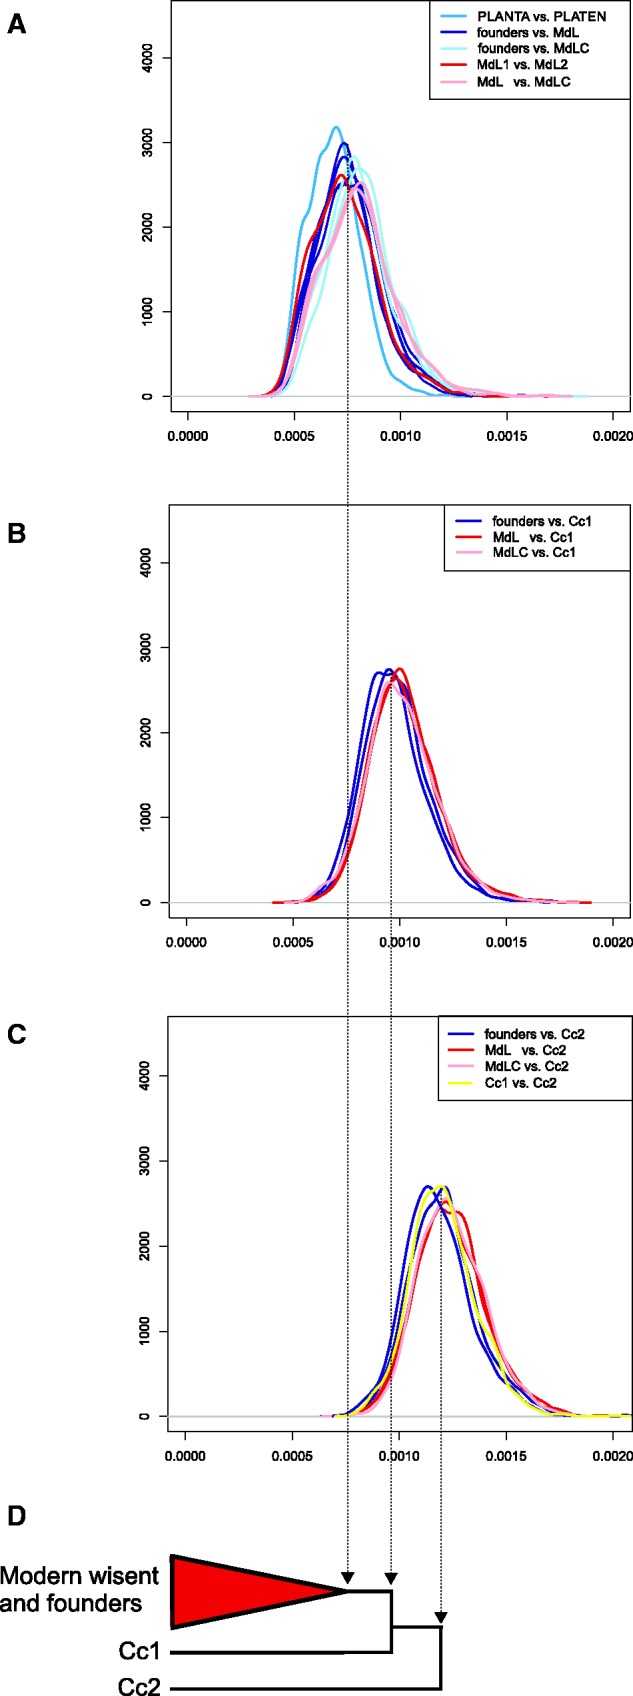
Fig. 2.

Pairwise genomic divergence among wisent. A, B, C, show probability densities for pairwise transversion divergence (x axes) along a sliding window of 1 Mb. Individual plots show all pairwise comparisons among modern and founding individuals (A); comparisons of modern and founding individuals and Caucasian wisent Cc1 (B); and comparisons of Caucasian wisent Cc2 and all other individuals (C). Specific comparisons discussed in the text are identified by colors, according to the key at the top right of each plot. Schematic neighbor-joining phylogeny based on whole genome distances (D).
