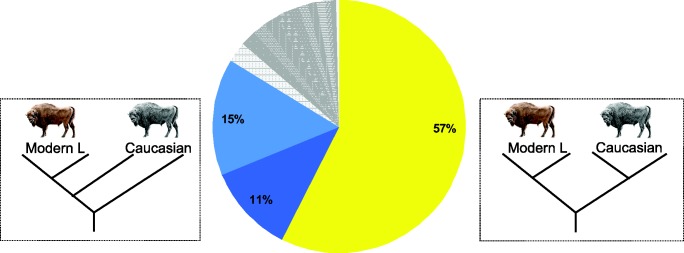
Fig. 3.
Population history of Lowland and Caucasian wisent, estimated using two representatives of each. The pie chart shows the percentage of 1 Mb genomic blocks supporting each alternatively rooted tree topology. This indicates fraction of genome blocks returning both wisent subspecies as reciprocally monophyletic. Dark and light blue colors show the next most frequently encountered topologies in which Caucasian wisent are paraphyletic (dark blue: Cc2 most divergent, and light blue: Cc1 most divergent, the first of which is compatible with estimates pairwise genomic divergence; see fig 2D).

