
Figure 7. Bar graph showing antibacterial activity of E. hirae F2 against E. coli, S. aureus, S. typhi, and Pseudomonas spp.
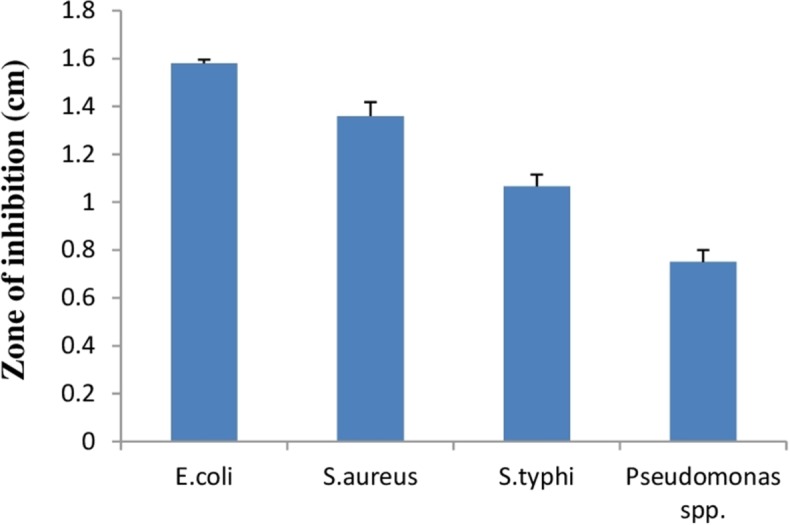
Error bars represent standard SD of the mean values of results from three replicate experiments.
Official websites use .gov
A
.gov website belongs to an official
government organization in the United States.
Secure .gov websites use HTTPS
A lock (
) or https:// means you've safely
connected to the .gov website. Share sensitive
information only on official, secure websites.
Error bars represent standard SD of the mean values of results from three replicate experiments.