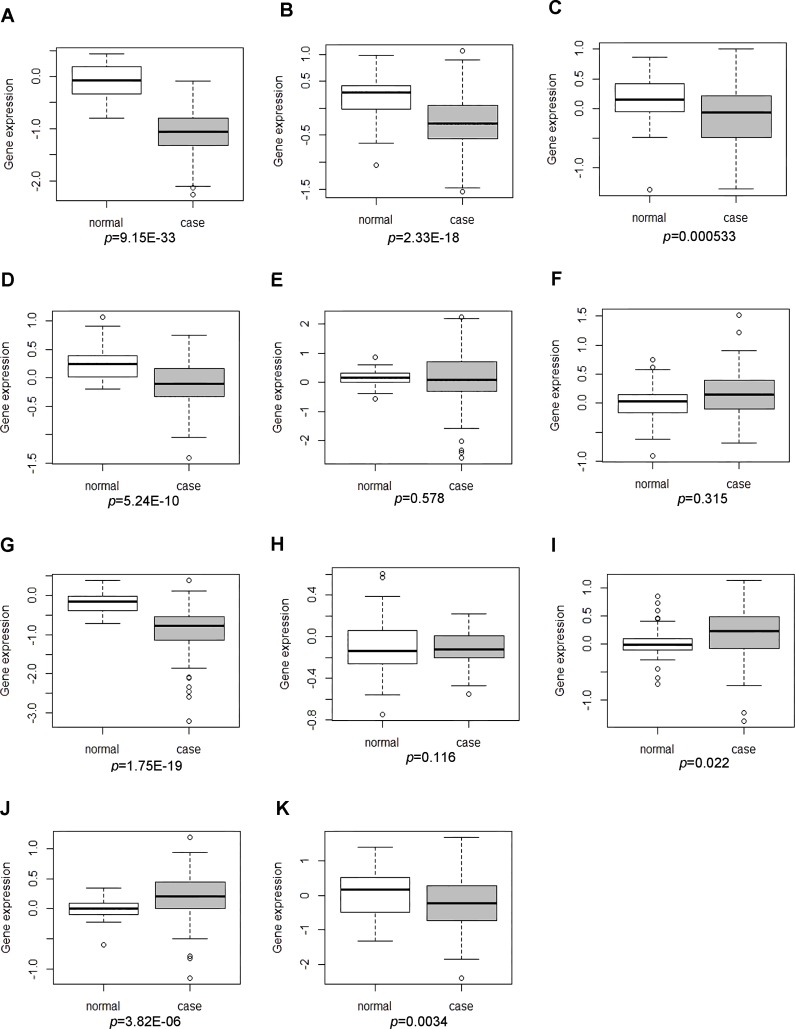
Figure 4. The expression levels of DEGs was analyzed in the GSE17755 dataset.
Box-plot diagram was used to describe the median and inter-quartile range of DEGs expression including LCK (A), SERBP1 (B), WIPF1 (C), PFKFB3 (D), RBFOX2 (E), CD47 (F), MAT2A (G), ATF6B (H), POU6F1 (I), CA5A(J) and NSA2(K).

