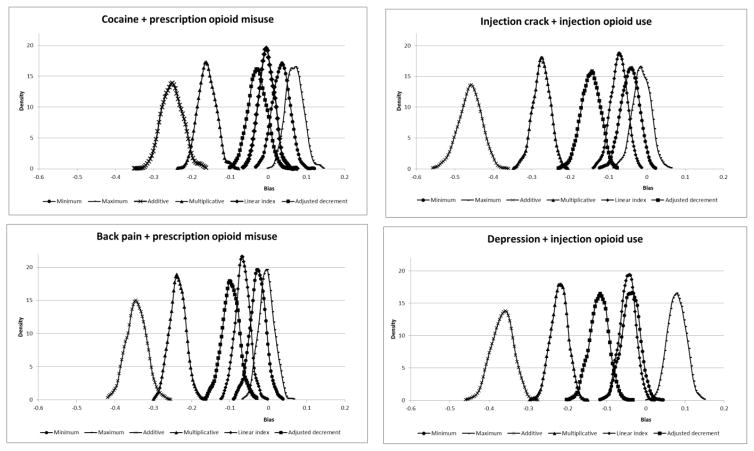
Figure 2.
Bias density graphs across joint health state utility estimators
Bias = estimated utility minus observed utility, using bootstrapped estimator distribution. Zero bias indicates more accurate estimator. Negative bias indicates the estimator underestimated the observed utility; positive bias indicates the estimator overestimated the observed joint utility.

