
Figure 8. Lack of HO-1 aggravates inflammatory responses in AAAs and in angiotensin II-treated macrophages.
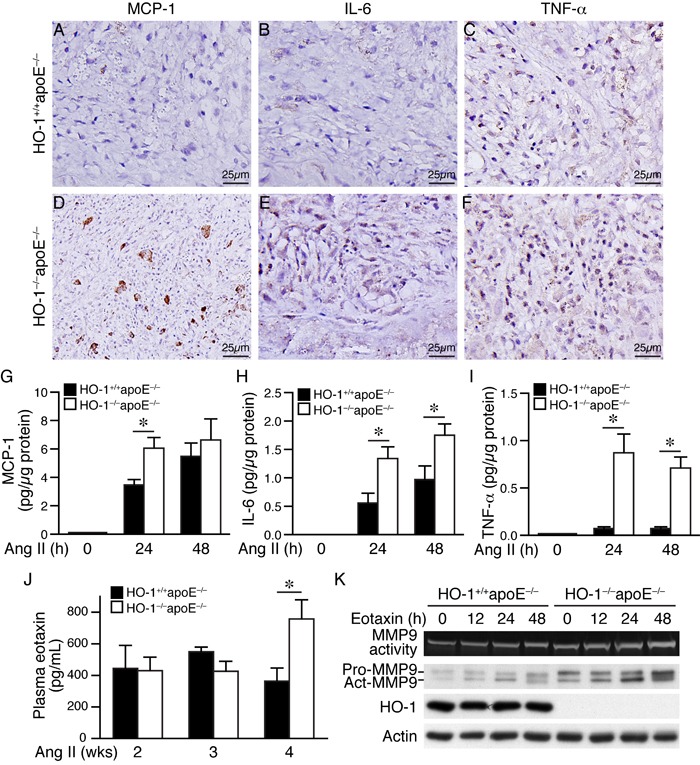
A.-F. Four weeks after angiotensin II infusion, HO-1+/+apoE−/− and HO-1−/−apoE−/− mouse AAA sections were immunostained with antibodies for MCP-1 A. and D., IL-6 B. and E., or TNF-α C. and F. Brown color indicates positive staining. G.-I. Peritoneal macrophages from HO-1+/+apoE−/− and HO-1−/−apoE−/− mice (3-4 different isolates from each genotype) were stimulated with angiotensin II (10 μmol/L) and conditioned medium harvested at different time points. Concentrations of inflammatory cytokines were measured using an ELISA kit, normalized to total protein amount and expressed as pg/μg protein. G. MCP-1 (n = 4 each genotype). H. IL-6 (n = 3 each genotype). I. TNF-α (n = 4 each genotype). Values are mean ± SE. *P < 0.05 vs. HO-1+/+apoE−/− macrophages. J. Blood samples from HO-1+/+apoE−/− and HO-1−/−apoE−/− mice 2 weeks (n = 3 and 4, respectively), 3 weeks (n = 7 and 4, respectively), and 4 weeks (n = 9 and 11, respectively) following angiotensin II infusion were collected and plasma concentrations of eotaxin measured. *P < 0.05 vs. HO-1+/+apoE−/− mice. K. HO-1+/+apoE−/− and HO-1−/−apoE−/− peritoneal macrophages (n = 3 different isolates from each genotype) were stimulated with eotaxin (100 ng/mL). Conditioned medium and cell lysates were harvested at different time points for zymography (MMP9 activity) and Western blotting to detect MMP9 and HO-1 expressions, and actin for normalization.