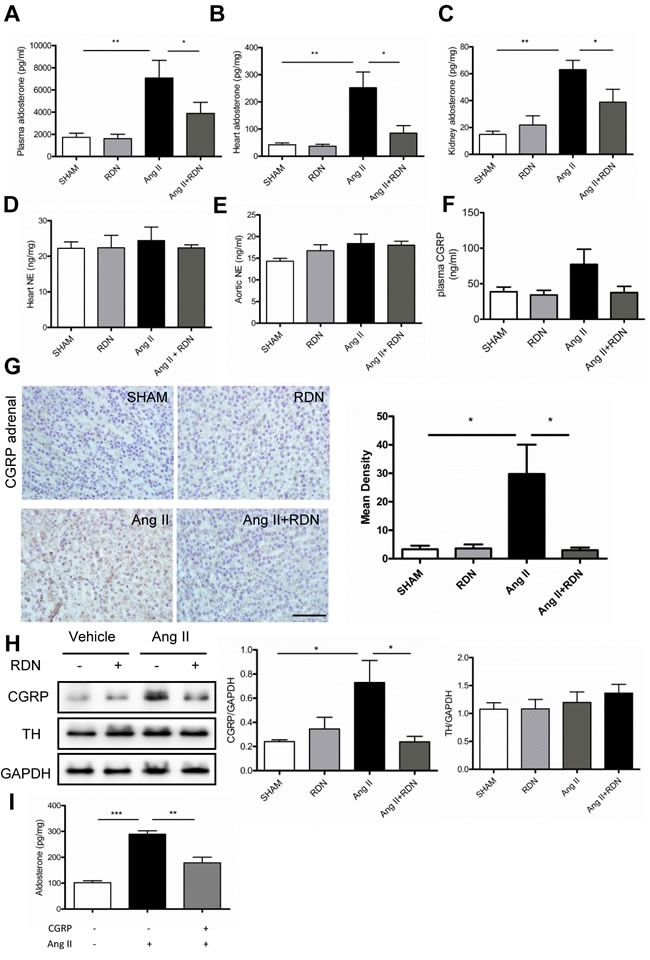
Figure 5. Effect of RDN on the level of Aldosterone and underlying regulatory mechanism.

A.-C., plasma, cardiac and renal levels of aldosterone measured by radioimmunoassay. D.-E., Heart and aortic NE levels in each group. F. The plasma CGRP level in each group. G. CGRP immunochemistry staining in adrenal medulla. Scale bar represents 50 μm. Values are mean ± SEM. n = 4-7 in each group. *P < 0.05. H. Western blot and quantification of CGRP and TH in the adrenal. I, CGRP (10-7 mol/L) inhibited Ang II (10-8 mol/L) induced Aldosterone secretion which wasmeasured in the H295R cell supernatant. Values are mean ± SEM, *P < 0.05, **P < 0.01,*** < 0.001.
