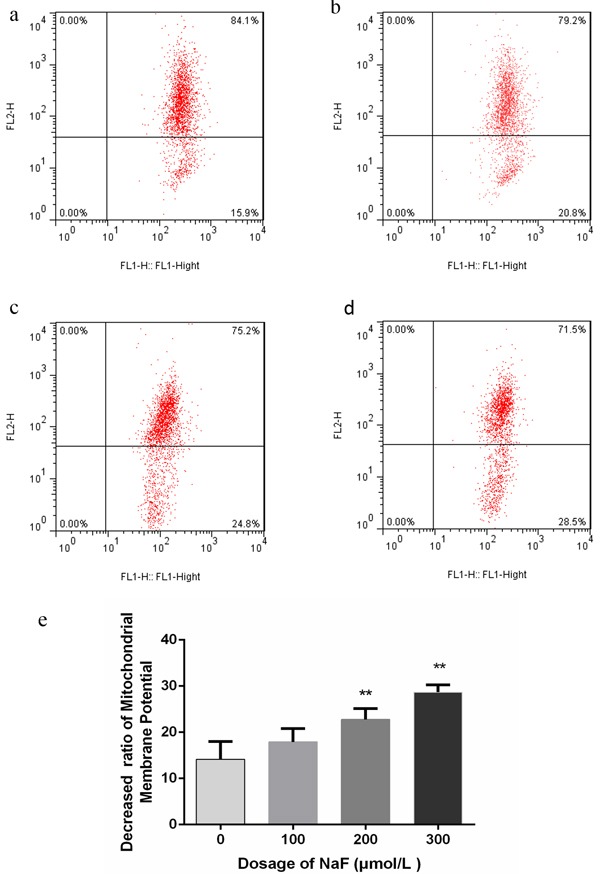
Figure 4. Effect of NaF on the MMP Δψm of splenic lymphocytes at 24 h.

a.-d. Assessment of mitochondrial membrane potential of lymphocytes with JC-1 staining by flow cytometry method. (a) CG, (b) LG, (c) MG and (d) HG. e. Quantitative analysis of the percentage of lymphocytes with green fluorescence. Data are presented with the means ± standard deviation, * p < 0.05, ** p < 0.01, compared with the control group. Data were analyzed by the variance (ANOVA) test of the SPSS 19.0 software.
