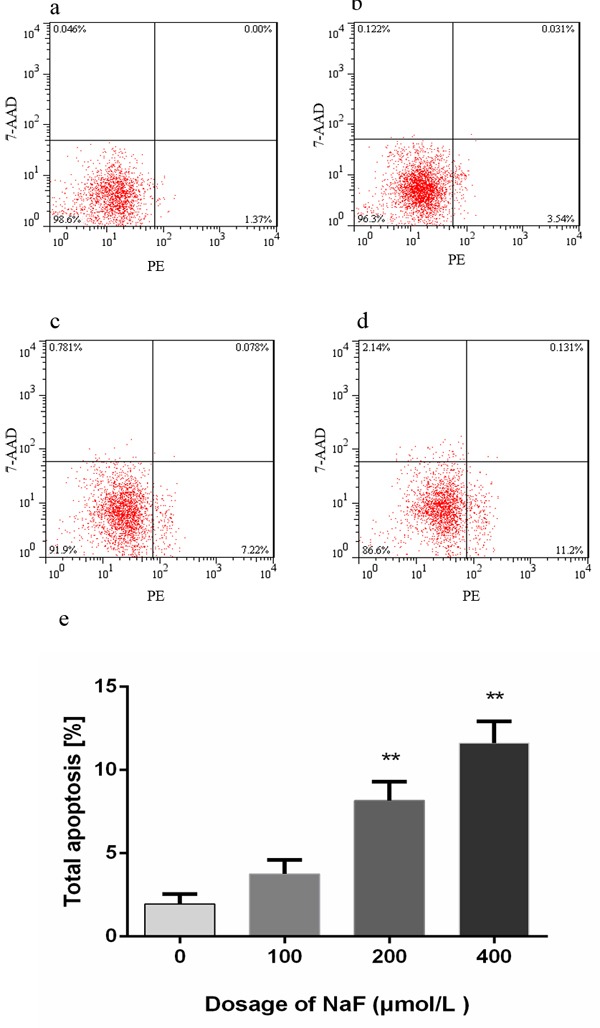
Figure 6. Effect of NaF treatment on apoptosis of cultured splenic lymphocytes at 24 h.

a.-d. Two-dimension scatter plots depicting distribution of cells positively stained for Annexin V-PE/7-AAD. (a) CG, (b) LG, (c) MG and (d) HG. Cells in lower left quadrant of each picture correspond to normal cells. Cells in right lower quadrant correspond to early apoptotic cells. Cells in right upper quadrant correspond to late apoptotic. Cells in left upper quadrant correspond to dead cells. e. Quantitative analysis of total apoptotic lymphocytes. Data are presented with the means ± standard deviation, * p < 0.05, ** p < 0.01, compared with the control group. Data were analyzed by the variance (ANOVA) test of the SPSS 19.0 software.
