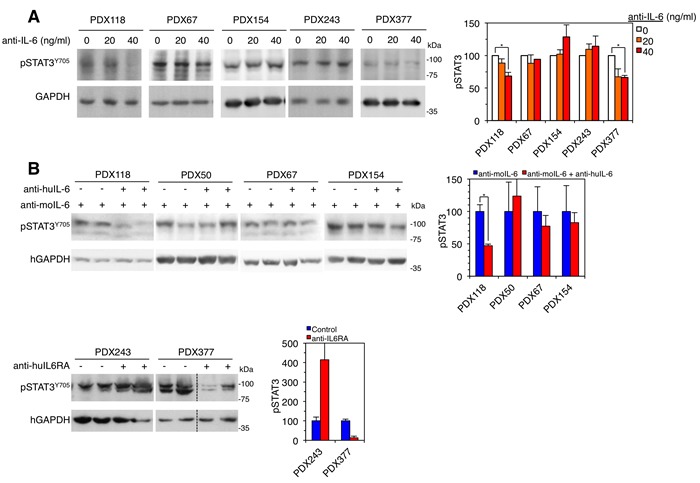
Figure 4. Effect of anti-IL-6 on the levels of phospho-STAT3.

A. Left, cell cultures established from the indicated PDXs were treated with different concentrations of anti-IL-6. Then, cells were lysed and the cell lysates were analyzed by Western blot with the indicated antibodies. Right, results from four independent experiments were quantified and expressed as averages ± SD. * P < 0.05 by the Student's t test. B. Left, samples from the indicated PDXs treated as shown in Figure 3 were lysed and analyzed by Western blot with the indicated antibodies. Right, results were quantified and expressed as averages ± SD. * P < 0.05 by the Student's t test.
