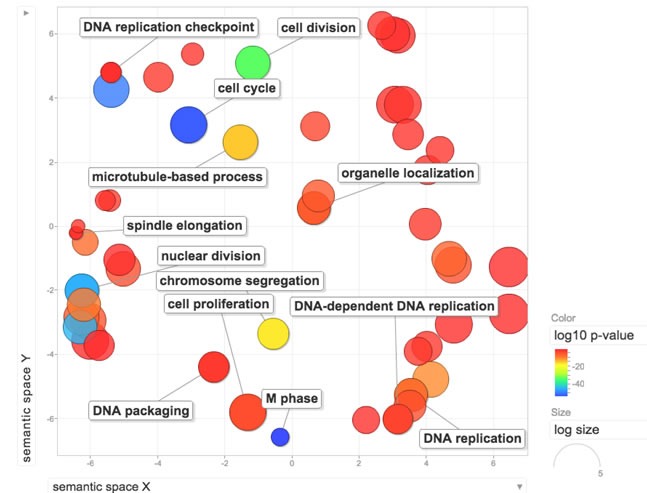
Figure 1. Functional analysis of the RBsig.

Enriched GO terms within the RBsig were plotted in a bi-dimensional space using a clustering algorithm that relies on semantic similarity measures using REVIGO tool [33].

Enriched GO terms within the RBsig were plotted in a bi-dimensional space using a clustering algorithm that relies on semantic similarity measures using REVIGO tool [33].