
Figure 2. Association between RBsig expression levels and genetic RB1 status.
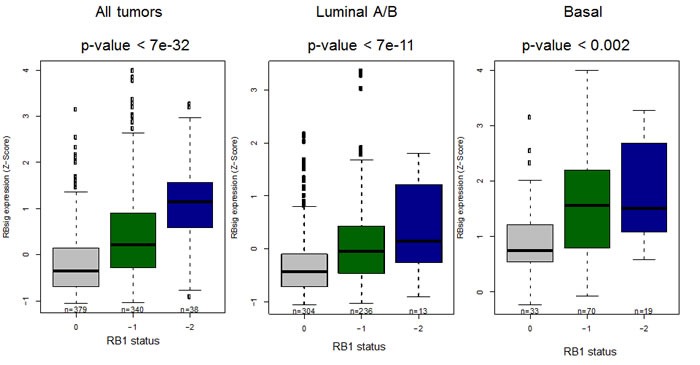
Boxplots represent the RBsig signature expression according to putative RB1 status (0= diploid, -1=heterozygous loss, -2=complete loss) in all tumors, regardless the molecular subtype and in luminal and basal subtypes in the TCGA dataset [3].