
Figure 3. Kaplan-Meier curves according to RBsig in the METABRIC dataset.
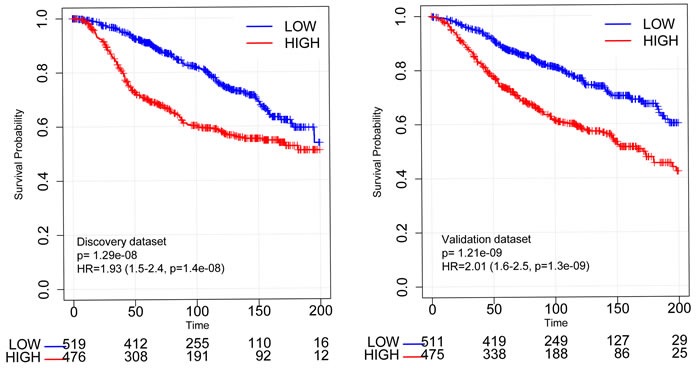
Patients included in the discovery set and in the validation set of the METABRIC dataset were stratified according to RBsig expression levels using the mean as cutoff, Kaplan Meier curves were generated and HR were calculated.