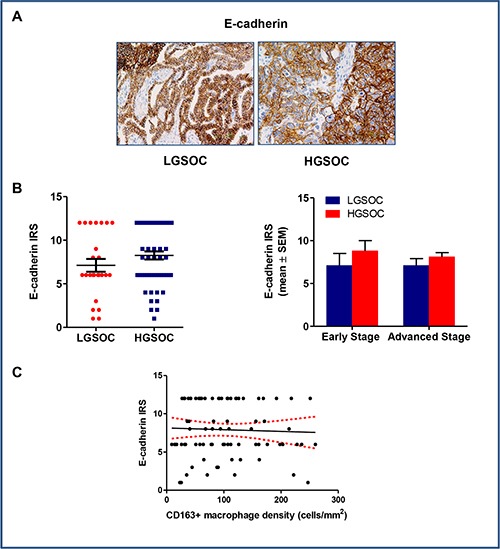
Figure 5. E-cadherin expression in LGSOC and HGSOC tissue specimens.

(A) Representative images for immunohistochemical staining of E-cadherin in clinical samples of LGSOC and HGSOC. Magnification 20×. (B) Scatter plot shows E-cadherin IRS (Immunoreactive receptor score) values and mean ± SEM for the entire set of patients (see legend to Figure 2 for sample sizes). Bar graphs depict data (mean ± SEM) following stratification per stage (see legend to Figure 2 for sample sizes). (C) There was no correlation between expression of E-cadherin and CD163+ macrophages density (cells/mm2) (n = 80), as showed by the Spearman rank analysis.
