
Figure 4. Prx I inhibited ROS induced tumor cell death.
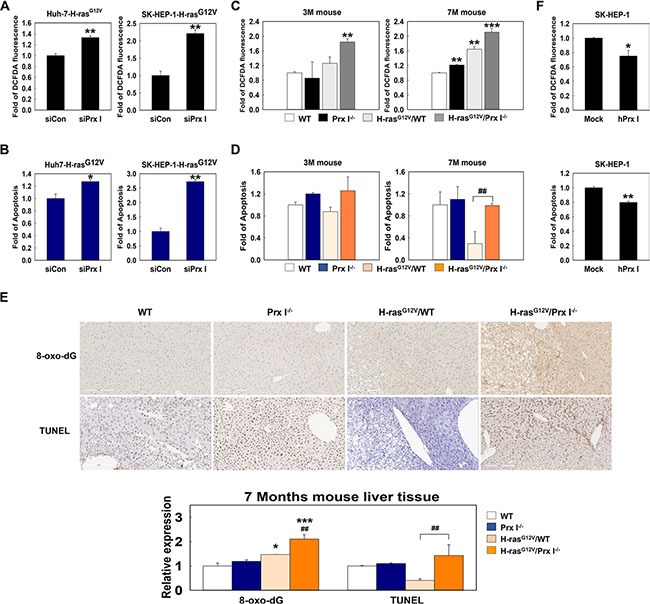
(A and B) Using flow cytometry to determine intracellular ROS (A) and cell apoptosis (B) in siRNA (scramble or Prx I)-transfected HCC-H-rasG12V cell lines. *p < 0.05, **p < 0.01 compared to siCon. (C and D) ROS (C) and cell apoptosis (D) level at 3 months (left panels) and 7 months (right panels) WT, Prx I−/−, H-rasG12V/WT, and H-rasG12V/Prx I−/− mice-liver tissues were determined by flow cytometry. **p < 0.01, ***p < 0.001 compared to WT mice and ##p < 0.01 compared to H-rasG12V/WT mice. (E) Paraffin-embedded liver specimens at 7 months WT, Prx I−/−, H-rasG12V/WT, and H-rasG12V/Prx I−/− mice were stained with 8-oxo-dG antibody and the TUNEL assay kit to detect ROS-induced DNA damage and cell death, respectively. Magnification, 200 X. Scale bars, 200 μm. *p < 0.05, ***p < 0.001 compared to WT and ##p < 0.01 compared to H-rasG12V/WT. (F) Intracellular ROS and apoptosis levels in SK-HEP-1-Mock cells and Prx I-SK-HEP-1 cells (SK-HEP-1-hPrx I) transfected by pCAGGS-hPrx I-HA-neo vector were detected by flow cytometry. *p < 0.05, **p < 0.01 compared to Mock. HCC cells; Huh7 and SK-HEP-1 cells. The data were repeated in at least three separate experiments and presented as mean ± SD.